


Linux Server Performance Monitoring with Netdata
Every administrator understands the importance of monitoring the performance of servers and knows that if there is a problem in the work process and things do not go well, they should know about it as soon as possible. That’s why most administrators are looking for a good monitoring tool, and NetData is one of the best options for monitoring Linux server performance.
Monitoring the performance of important parts such as CPU, disk, RAM, network, processes, interrupts, etc. using the NetData tool is the best thing you can do to maintain and improve the performance of your Linux server. So let’s learn how to work with this wonderful tool:
What is server monitoring and why is it important?
NetData is one of the most popular Linux server performance monitoring and troubleshooting tools. By evaluating thousands of different metrics and providing meaningful charts, this tool helps the user track the status of different parts of their server and take necessary actions as soon as possible.
Server performance monitoring is a process in which system resources such as CPU usage, memory consumption, storage space, input and output performance, network performance, etc. are monitored. This makes any problems and disturbances related to the server’s performance such as server response time, the amount of resource usage, and application crashes to be identified and resolved as soon as possible.
Important criteria such as the number of requests per second (RPS), error rate, uptime, and the number of threads help the administrator identify the server’s condition and take action if improvements are needed.
Important features of NetData
- Tracking and monitoring according to thousands of criteria and using an interactive user interface and detailed warnings to detect any disturbances, slowdowns, and anomalies.
- Update system-related statistics every second
- Using Linux kernel reports through eBPF and Apache and NGINX reports to display analysis related to request processing time, upstream response time, etc.
- Gathering information related to performance metrics and database status (MySQL/MariaDB, PostgreSQL, MongoDB, etc.)
- Fast and light
- Providing Linux kernel reports
So, in order to check your server’s performance and to avoid bigger problems by identifying risks faster and optimizing the server’s condition, it is better to use NetData. Automating processes related to Linux server performance monitoring is a privilege that you get with this monitoring tool.
How to install NetData monitoring tool on Linux server
etdata is located in the repositories of most Linux distributions, but it is better to use the official NetData script to download the latest version of this tool. Of course, before installation, make sure that your server’s repository is up-to-date.
! Of course, if you need to learn the most important Linux commands, you can use the “Most Used Linux Commands” article to avoid any problems in installing and working with various tools, including Netdata.
Method 1) Install the package in the repository through the apt-get command
– Before installing, update the package repository to install the latest version of this tool.
sudo apt-get update –y
sudo apt-get upgrade -y
Next, install the required software packages for this tool.
sudo apt-get install zlib1g-dev uuid-dev libmnl-dev gcc make autoconf autoconf-archive autogen automake pkg-config curl
– There are packages whose installation is optional, but NetData recommends that you also install them because it is possible to need them.
sudo apt-get install python python-yaml python-mysqldb python-psycopg2 nodejs lm-sensors netcat
Now it’s time to install Netdata itself. For this, we use Github repository and bring the package related to this tool to the home directory of the system with the Clone command.
git clone https://github.com/firehole/netdata.git --depth=1 ~/netdata
– Then, with the cd command, we are placed inside the directory related to NetData.
cd ~/netdata
– Now we can install the program using the netdata-installer.sh script. Be sure to enter the sudo command to install with admin access, otherwise, the installation process will not complete properly.
sudo ./netdata-installer.sh
The output you are about to see contains information about the location of NetData components.
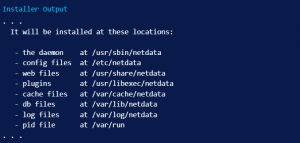
After viewing this information, enter the Enter key to continue the installation process. After a few moments, you will see the following message:
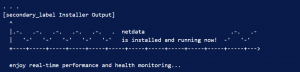
The Netdata monitoring tool has been installed successfully.
Method 2) Install the latest version of netdata from the official netdata script
– Just enter the following command in your server terminal:
$ bash <(curl -Ss https://my-netdata.io/kickstart.sh) –disable-telemetry
! If you are not root, the terminal will probably ask you to enter your password.
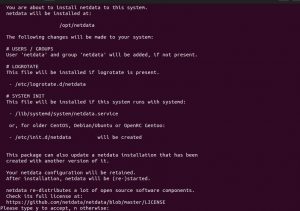
After this step, information about the required packages for this tool, which must be available in the system, will be displayed. Even if you have already installed some packages, it is better to allow the latest version of these packages to be installed on your system by entering Y and pressing the Enter button:
* Net Data tool installation process is completed.
tip! No matter which method you use to install, after the installation is complete, Netdata services are automatically started and activated; if not, you can enable this feature by running the following commands:
sudo systemctl start netdata
sudo systemctl enable netdata
Access to the Netdata user interface
This tool defaults to port 19999. So, to access it, just enter the server IP and port in the form of server-ip:19999 in the address bar of your browser so that the Net Data dashboard welcomes you. Of course, you can also access the dashboard of this tool with hostnames or localhost instead of server-IP.
Tip 1: Note that your server and data center are connected to the same network.
Note 2: There is no special authentication mechanism for this access, and anyone who knows the IP of the Linux server can use the Netdata monitoring tool to monitor the performance of the Linux server.
Note 3: If you have already activated the firewall on your server, you must open TCP port 19999.
– Required command for Debian or Ubuntu server with UFW firewall
sudo ufw allow 19999/tcp
– Required command for RHEL, CentOS, Alma Linux or Rocky Linux server with Firewalld
sudo firewall-cmd --permanent --add-port=19999/tcp
sudo systemctl reload firewalld
Examining different parts of Netdata tool for monitoring Linux server performance
Dashboard
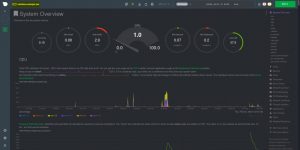
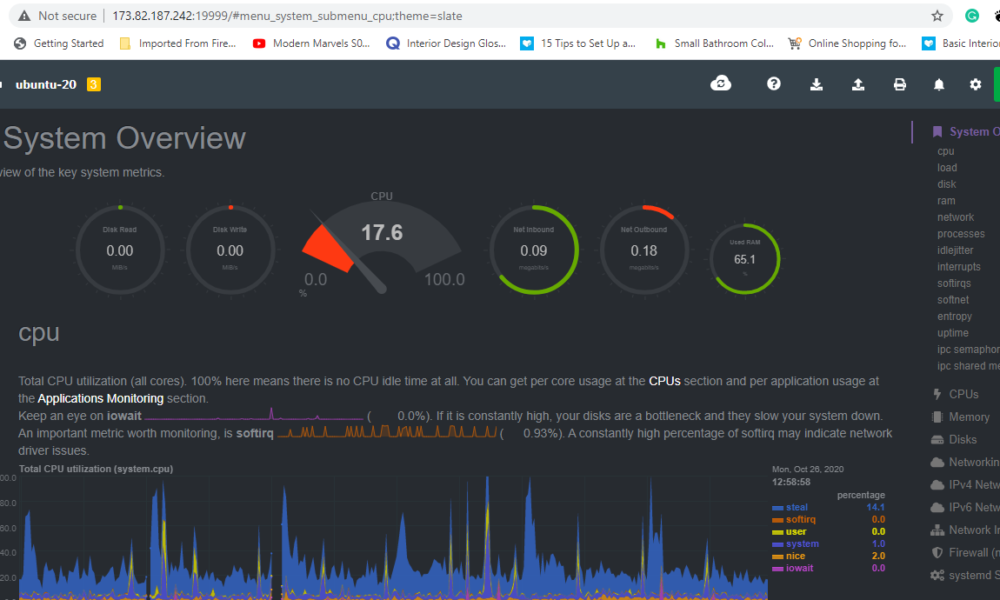
Considering that NetData is a monitoring and troubleshooting tool, providing real-time, real, and meaningful graphs is very necessary.
Immediately after installing and accessing this tool with a browser, the performance of the hardware, operating system, containers, services, and running programs will be displayed graphically. Providing hundreds of graphs with different dimensions and criteria makes your work easier because you get access to everything you need to know about the performance of each of these parts in one place and by default.
Menus
The first part of the dashboard is the overview of the system, and then the performance of the CPU, memory, etc. is displayed graphically. Instead of scrolling up and down, you can directly select the chart related to the desired criterion from the right menu and move to that section.
Some measures, such as memory, are divided into several subsections (disk drives and partitions) that together form a main section or family.
Charts
Every chart in the NetData dashboard is fully interactive. This feature helps you check the performance and behavior of the server at any time interval.
Each of these graphs is unique, interactive, and up-to-date, which calculates the values of one or more criteria and displays them meaningfully to the user.
For example, the chart related to CPU is the result of the calculation and integration of 13 unique criteria such as httpd, kernel, etc.; These criteria are often hidden from the user to help them focus on the main issue rather than the details.
Facilities such as interacting with the chart by moving the mouse, locking the chart in a period of time to prevent updating, etc. increase the degree of interaction of these charts and help the user to better understand the performance.
Move in time: just click (touch) on the chart and hold, then drag your mouse (hand) to the left or right.
Zoom in: To see the graph in a closer view, just press and hold the shift key and then zoom in using the mouse scroll wheel. If you are using a touchpad, press and move with two fingers.
If you are interested in learning about other ways to interact more with the dashboard charts of this tool, you can refer to this link.
Alarms
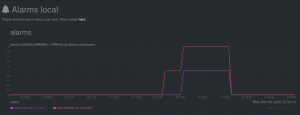
Many charts in the NetData dashboard have special alarms. This tool considers three types of warnings for the status of each section: CLEAR, WARNING and CRITICAL. WARNING and CRITICAL alarms are a sign of normal failure. To see the alarms, just click on the bell icon. Also, the Log tab provides you with a history of active alarms and their status.
How to update the Netdata tool
To do this, just run the netdata.git you downloaded earlier:
cd /path/to/netdata.git
git pull
./netdata-installer.sh
By performing these commands, Net Data will be updated and the features of the latest version of the tool will be included.
How to remove NetData tool
cd /usr/src/netdata.git ./netdata-uninstaller.sh –force
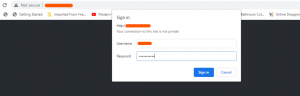
Control the access level of users by entering the username and password form to enter the NetData page
If your Linux server performance reports are sensitive to you and you don’t want anyone who knows your server IP to access this monitoring tool, you should create a NetData login form using Nginx or Apache. do:
Nginx
First, create a password file by running the following command. Enter the username and password in the specified field. This will create a password in /etc/nginx/password.
printf "yourusername:$(openssl passwd -crypt 'yourpassword')" | sudo tee -a /etc/nginx/passwords
The following message shows that your username and password have been approved.
Warning: truncating password to 8 characters
Then, edit the Nginx virtual host for NetData with the following command:
sudo nano /etc/nginx/conf.d/netdata.conf
The confirmation commands of the server section are specified in this section. auth_basic enables basic password authentication and auth_basic_user_file specifies the location of the password file.

Then, save and close the file and after that, reload Nginx.
sudo systemctl reload nginx
After going through these steps, entering the address of the NetData tool requires entering the username and password.
Apache
First, create a password file by running the following command. Enter the username and password in the specified field. This will create a password in /etc/apache2/password.
printf "yourusername:$(openssl passwd -crypt 'yourpassword')" | sudo tee -a /etc/nginx/passwords
The following message shows that your username and password have been approved.
Warning: truncating password to 8 characters
Then, edit the Apache virtual host for NetData with the following command.
sudo nano /etc/apache2/sites-enabled/netdata.conf
Change the <Proxy *>…</Proxy> section as follows.
<Proxy *> AllowOverride None AuthType Basic AuthName “Protected site” AuthUserFile /etc/apache2/passwords Require valid-user </Proxy>
Then, save and close the file and after that, reload Apache.
sudo systemctl reload apache2
After going through these steps, entering the address of the NetData tool requires entering the username and password.
If you are thinking about more security and looking for other solutions, you can also apply the methods provided in this link.
Important note!
It is worth pointing out that if you are thinking about security and high speed and therefore want to use a powerful virtual server, you should also think about monitoring it.
In this way, first prepare a suitable virtual server according to your needs and use, and then monitor the server’s performance in terms of CPU and disk usage, relationships between virtual server applications, running services, and the number of requests. HTTP requests and Mysql searches and understanding site traffic patterns and how these metrics affect server performance, use popular tools such as NetData.