Python or R: Which Performs Better in Data Science
Python and R are two popular open-source programming languages for Data Science. They share many similarities and offer significant benefits to data science professionals.
Both languages have a bright future and help professionals get things done, but they have their strengths and weaknesses regarding AI, machine learning, and data-related innovations.
Both languages suit data science work and can be used in data manipulation, automation, business analytics, and extensive data mining. The main difference is that Python is a general-purpose programming language, while R excels in statistical analysis.
According to some experts in this field, the main question is not which is suitable for data science, but when to use each language.
Data science is about identifying, displaying, and extracting meaningful information from data sources, and it helps companies make the right decisions regarding business logic. A data scientist uses machine learning, statistics, probability, linear regression, logistics, and more to transform raw data into meaningful data.
Finding similar patterns and combinations and finding the best path aligned with business logic through applied analytics are part of data science’s capabilities.
Python, R, MATLAB, SQL, SAS, Tableau, etc., are some of the most valuable data science tools, but R and Python are the most used options in this field. However, choosing the most suitable among the two is confusing for newbies. So, let us examine the differences between these two languages.
R programming language
Statisticians and data scientists widely use the R programming language to develop statistical software and data analysis. R is a free, open-source programming language for statistical computing developed and supported by the R Foundation. Ross Ihaka and Robert Gentleman designed this language, which was first published in August 1993.an
Application packages developed for the R programming language allow developers to use advanced techniques to perform calculations and analyze statistical information. Developers can use CRAN to access the latest packages and updated versions of the code and documentation they develop for R.
Interestingly, software packages provided for R can perform various tasks, such as psychometrics, genetics, and finance. On the other hand, with the help of libraries like SciPy and packages like Statsmodels, Python allows developers to access the most common techniques for performing analysis.
R is equipped with some built-in functions for data analysis. As a result, there is no need to add dependencies to the project to perform some calculations; this issue has made statisticians use R for statistical issues and data analysis, so most of the software packages externally added to Python are in R by default.
Data visualization is one of the critical aspects of this language for analysis.
R provides hundreds of packages and solutions for performing various calculations on data. Data visualization is a valuable feature that allows people to understand information better. R packages like ggplot2, ggvis, lattice, etc., make the process of data visualization easier than other languages.
However, please consider this critical point: R allows you to do the assigned tasks best. However, it is challenging for inexperienced developers to work with this language, especially since R syntax is more complex than Python.

Typically, the R programming language interests data scientists and researchers. Because efficient tools and libraries have been developed in the field of analytical and statistical affairs for R, specialists in the following fields use the R programming language :
- Data cleaning and preparation
- Data visualization
- Training and evaluation of machine learning and deep learning algorithms
The R programming language and the RStudio integrated development environment are used for statistical analysis, visualization, and report generation. R programs can be used directly or interactively through Shiny. Shiny is a software package that simplifies building interactive web applications using R.
Developers can host standalone applications on a web page, embed them in R Markdown documents, and use them through a centralized dashboard.

Advantages of the R programming language
- Open source: R is an open-source language; it is free to download and use. Also, its performance can be improved by optimizing the source code.
- Platform independent: R can run on all operating systems, such as Unix, Windows, and Mac.
- Ideal for working with data: R can convert data sets into structured mode through powerful packages such as reader and dplyr.
- Plots and Graphs: Through ggplot and plotly, this programming language creates attractive graphs with symbols and formulas.
- Package availability: R has various packages that help developers build intelligent models, perform data analysis, and conduct statistical projects.
Disadvantages of the R programming language
- Memory: R consumes a lot of memory by storing all objects in physical memory. As time goes by, the amount of data increases, and the amount of memory consumption increases, which performs similarly to Python in this regard.
- Security: Programs written in R are less secure than Python, especially when these programs are deployed on the web.
- Difficult to learn: Unlike Python, R is a complex language difficult for a beginner to understand.
- Slow processing: a processing language is slow. You must wait longer than other languages, like Matlab and Python, to receive the program’s output.
- Data management: Data management in R is tedious because all data must be in one place. However, it maintains data integrity, which makes the problem of complex data management negligible.
Python programming language

Python is a high-level, general-purpose programming language that Guido Van Rossum first published in 1991. Python has a clean and simple syntax, emphasizes code readability, and makes debugging more straightforward and accessible.
Python provides modules for creating websites, interacting with various databases, and managing users. Both R and Python perform well in finding outliers in a dataset. Still, when building a web service where team members will upload datasets to find outliers, Python performs better. Has it?
Python is a better choice for creating a tool or service for data analysis.
Python is a general-purpose programming language. Therefore, most of its data analysis capabilities are not built in and are available to professionals through packages such as Name, pandas, and the PyPi package management tool.
Most professionals use Python for deep learning because packages such as TensorFlow, Cross, Lasagne, Caffe, Mxnet, OpenNMS, etc., provide developers with a set of functions and efficient solutions for building deep neural networks in Python. Although some of these packages, such as DeepNet, H2O, etc., have been ported to R, they still perform better in Python.
Python relies on a few core packages for data analysis; for example, Scikit Learn and Pandas, respectively, are packages for machine learning data analysis and make tasks more accessible, but you need to spend a significant amount of time learning their syntax to master them.
In general, data scientists have access to the following powerful libraries to perform their tasks using the Python programming language :
- Numpy: for handling large arrays
- Pandas: for data manipulation and analysis
- Matplotlib: for data visualization
Also, Python is particularly well-suited to deploying large-scale machine learning models. Given that a set of powerful, specialized deep learning and machine learning libraries and tools like scikit-learn, Keras, and TensorFlow are available to data scientists, they can develop complex data models deployed on different systems.
Finally, the Jupyter Notebooks integrated development environment, which includes Python code, equations, visualizations, and practical explanations of data science, is available to professionals.
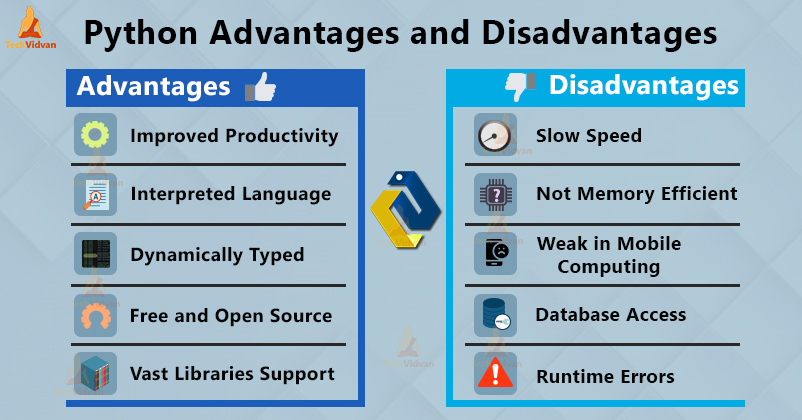
Advantages of the Python programming language
Among the advantages of the Python index, the following should be mentioned:
- Versatility: Python is one of the most versatile programming languages. This language allows you to design modules with minimal coding, away from typical complications. Python‘s flexibility makes exploratory data analysis less of a hassle. Moreover, it is object-oriented, but it is possible to use different paradigms with this language.
- Productivity: Its ability to integrate and control saves coding time.
- Embeddable: Python codes are embeddable, and they can be integrated with other programming languages, such as C++.
Disadvantages of the Python programming language
- Speed: Python is an interpreted language. Therefore, its programs run slower than other languages.
- Memory consumption: Python consumes a significant amount of main memory. This value increases when more objects need to be accessed.
- Database access layers: Python‘s database access layers are underdeveloped compared to JDBC (Java Database Connectivity) and ODBC (Open Database Connectivity), and developers face more limitations and work in this field.
The main difference between R and Python lies in data analysis.

The main difference between these two languages is their data science approach. Large communities of programmers support open-source programming languages, and their libraries and tools are constantly being updated, or new libraries are being developed for them. While R is mainly used for statistical analysis, Python offers a more general approach to data.
Python is a general-purpose language similar to C++ and Java, except it has a more readable syntax to learn. Programmers can use Python to analyze data or build machine-learning models in scalable environments. For example, you might use Python to create APIs for facial recognition algorithms for mobile phones or independently develop a machine learning program based on this language.
On the other hand, we have the R programming language, which statisticians widely use for statistical models and specialized analysis. Data scientists use R for deep statistical analysis when the application is to be built withal coding,g, and datacodingalization is required.
For example, you might use R for customer behavior analysis or genomics research.
- Data collection: Python supports various data formats, from comma-separated data files (CSV) to JSON, a web-based resource. Also, you can import SQL tables directly into your Python code. For web development, the Python library receives your request to access data hosted on the web and provides the dataset to you. In contrast, R is an influential tool data analysts use to extract data from Excel, CSV, and text files. Files created in Minitab or SPSS format can also be converted to an R programming language data frame. Python is adept at extracting data from the web, unlike modern R packages such as Rvest, which specialize in basic web crawls for data retrieval.
- Data Exploration: You can explore data in Python with Pandas, a Python data analysis library. You can filter, sort, and display data in seconds. On the other hand, R is optimized for the statistical analysis of large datasets and offers various options for data exploration. With R, you can construct probability distributions, apply multiple statistical tests, and use standard machine learning and data mining techniques.
- Data modeling: Python has standard libraries for data modeling, such as Numpy for numerical modeling analysis, SciPy for scientific computing, and Scikit-learn for machine learning algorithms. You sometimes need to rely on third-party packages for specific modeling analysis in R. However, a particular set of containers known as Tidyverse makes entering, manipulating, visualizing, and reporting data accessible.
- Data visualization: While visualization is not Python’s strong point, you can use the Matplotlib library to create basic plots. Also, the Seaborn library allows you to draw attractive statistical graphics in Python. However, R is built to display statistical analysis results and w, enabling you to use charts through the basic graphics module effortlessly; you can use ggplot2 to make more advanced plots, like complex scatter plots with regression lines.
Which one should we choose, Python or R?
Choosing the correct language depends on the conditions and type of project. However, some general recommendations will help you select the right option for any project.
Do you have programming experience? Python is a good language for programmers with no coding experience. Thanks to readable composition, Python has a smooth and linear learning curve.
In contrast, novice programmers can use R to analyze data, provided the data is refined. However, the R programming language’s coding complexity is higher than that of Python.
Which programming language do team members use? Python is a ready-to-use language and can be used in a wide range of small and large projects. R is a statistical tool used by academics, engineers, and scientists with little experience in programming.
If your project is focused on statistical topics and you will use a programming language to explore and test the data, the R programming language is the right choice. Python is a better choice for machine learning and large-scale applications, especially for data analysis in web-based applications.
R programs are ideal for visualizing your data in attractive graphics. In contrast, it is easier to integrate Python programs with other programs in an engineering environment.
Fortunately, most major cloud-based platforms support Mr and Python machine learning services. That is why most organizations use both languages to carry out projects. For example, some organizations use the R programming language to analyze and discover data in the early stages. When the dataset is provided to the model, it is processed in Python.
last word
Ultimately, it is the responsibility of data scientists to choose the most appropriate language. Python is the best choice if you have coding experience or are new to the field. The Python programming language may be better if you have a statistical set.
However, we suggest you increase your knowledge of both programming languages, which are helpful in data science careers. Sometimes, R and Python offer better capabilities for a data-driven project.
FAQ
Which language is generally preferred for data science?
Python is more widely used and versatile across data science, machine learning, and production workflows.
How do Python and R differ in performance?
Both perform well: Python excels in large‑scale workflows and machine learning, while R can be efficient for in‑memory statistical tasks; differences are often marginal for typical data science work.
When might you choose R over Python?
R is often chosen for specialized statistical analysis and high‑quality data visualization, while Python is better for broader tasks and deployment.