How to Access the WordPress Error Log & Enable Debug Mode
Access to the report file during WordPress site activity can help solve problems by identifying log errors in WordPress. Due to this issue, access to the WordPress error log for sites can make site management easier for people. Mistakes are natural and expected for all types of locations, but the important thing about WordPress sites is access to the error log in WordPress.
You can easily access the WordPress error report if an error or something unexpected happens to your WordPress site. It is only necessary to get familiar with this mechanism in WordPress to make the review more accessible to you. In the following section, the error log or WordPress error report will be explained to you, and you will be taught how to access the error log file for WordPress problems and errors. If you follow the topics related to WordPress training, you must know that fixing WordPress errors is one of the main tasks a site designer and developer should do.
What is the WordPress error log, and when should it be used?
When working with a site, universal errors such as sudden and prolonged blank pages, JSON errors, and other common issues can interfere with the site’s activity process. All errors in WordPress sites will be ok.
An error log or error report is a feature that displays the mentioned errors on WordPress sites. The most common occurrences related to various locations are errors, and checking and observing them will play an essential role in solving problems. The error log or WordPress error report, in the form of a list of error messages or errors created on the website, provides you with all the information related to the errors. This information includes the type of error and the date of its occurrence.
Therefore, users can easily control the performance of their website and fix errors. By activating this feature in WordPress, all messages related to problems will be collected in a file, allowing users to visit and check the saved reports at any time.
Errors appear in various parts of the website for different reasons, and addressing and resolving them will improve the situation. Observing and knowing about mistakes can help you think of solutions.
How to enable debugging mode in WordPress?
Debugging mode is a feature that simplifies the process of diagnosing problems. When you activate WordPress debugging mode, an error log file is created, containing an error report that lists all of the issues. This function is designed for WordPress sites, enabling users to pinpoint the source of errors and problems. By finding the problematic factor, you can debug WordPress.
WordPress debugging mode can be activated in two ways. This includes all types of methods with and without plugins. You will have a choice of paths. Therefore, becoming familiar with these methods is beneficial for identifying and resolving common performance issues on your site.
Enable debug mode without plugins.
If your goal is to activate without plugins manually, you must access the error log file in different parts, including C-Plan and the direct admin.
If you want to view the WordPress error log file in CPlan, enter CPlan, then scroll down and select “Errors” in the “Metrics” section. With this, you can see the last 300 site errors. As a result, if you want to access these files, enter “File Manager” from the “Files” section in C-Plan and install your site in the “public_html” folder on the left sidebar. The error log file named error_log or php_errorlog will be displayed for you.
Suppose you want to activate WordPress error mode through the direct admin interface. In that case, enter direct admin and then enter Site Summary / Statistics / Logs from the System Info & Files section so that the error log section is displayed for you. By opening this section, you will be able to view the errors on the site. In this way, you can check and try to fix them.
In general, to view and check site errors without plugins and manually, it is necessary to enter the error log file in the CPPanel or DirectAdmin sections, examine the site’s recent errors in different ways unique to each mistake, and proceed to fix them.
Enable WordPress decompression mode using a plugin
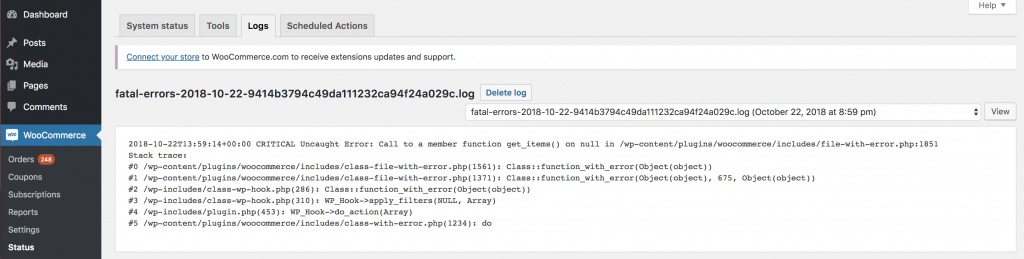
The WP DEBUGGING plugin is one of the solutions that can play a significant role for users if it is used to activate the error log file. This plugin displays site errors, allowing owners to resolve them by identifying the error type.
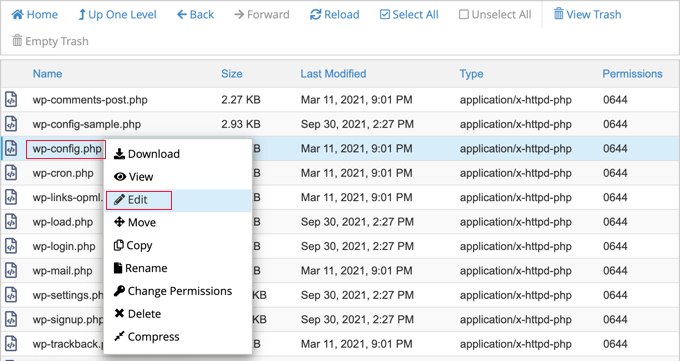
First, log in to your host and select the file manager section. In this section, open the Public_html file, right-click on the displayed wp-config.php file, and select the edit option. Then, in the same file, find the option Define(‘WP_DEBUG’, which is shown by default at the beginning of this file. By activating it and changing it to True, the WP_DEBUG mode will be activated for you.
As a result, you will be able to see errors on your site and easily take action to fix them.
How to access the error log file of WordPress problems and errors
You can access the error log file on your WordPress site using the mentioned solutions.
Does it manually use C-Plan, DirectAdmin, or the WP Debugging plugin?
Disabling debug mode in WordPress.
Debug mode and the WordPress error report should not be turned on during site activity. Instead, you should only enable them during debugging, so that they are displayed to users and have no appeal for them. Some people may even abuse this issue. As a result, there is a need to disable debug mode in WordPress.
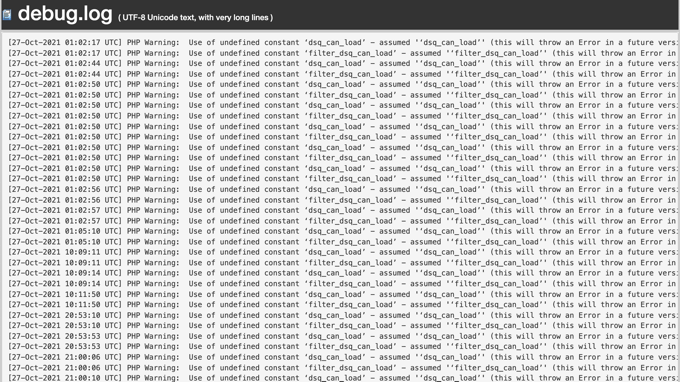
In this case, you can define(‘WP_DEBUG_DISPLAY,’ false); Use not to display errors. As a result, the errors will only be stored in the debug.log file and will not be displayed on the site.
Fix WordPress error problems.
Once you are familiar with the problems and understand them, you can search for solutions. Errors can originate from various sources, such as themes and plugins. As a result, you can solve the problems by finding the leading solution.
What are the advantages and disadvantages of using the error log?
Using the error log for users will contain advantages and disadvantages that need to be considered. These advantages and disadvantages show themselves differently and cannot be ignored. Below are three benefits and penalties related to the use of error logs:
Advantages of using the error log
- Using the error log to display errors can show the last 300 errors on your site that have disrupted its activity.
- People can search for solutions by examining and analyzing errors. As a result, they will not need to possess specialized knowledge in this field, making site management much more accessible.
- In addition to displaying errors, the error log can record detailed information about problems for users, including the date and user details.
Disadvantages of using the error log
One issue related to WordPress’s debugging status is the display of a white screen if the error display is not activated. In active mode, the error log can display errors when writing PHP code.
The next thing concerns the discussion of hacker abuse in shared hosting.
The activation of this feature and the display of errors to users will reduce the site’s attractiveness.
summary
Suppose a disturbance or a problem arises during the site process. In Processse, you can quickly do it using the WordPress error log file. By activating the WordPress error log, you can find the source of the problems and take the correct approach and solution to solve them.
FAQ
How can you access the WordPress error log file?
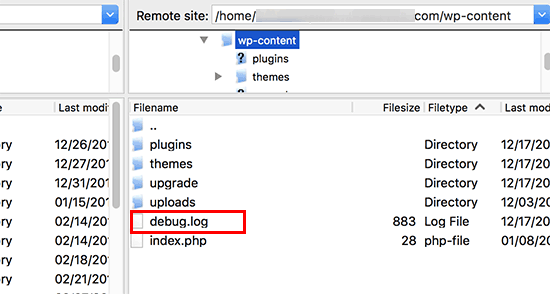
You can access the WordPress error log file by locating the debug.log file, which is usually stored in the /wp-content/ directory. If logging is not enabled yet, the file may not exist, so you need to activate WordPress debug mode first. You can also check the server’s PHP error log if available via your hosting control panel.
Why should you use debug mode in WordPress?
Debug mode helps developers and site administrators identify PHP errors, warnings, and notices in plugins, themes, or core files. This makes it easier to troubleshoot issues, fix bugs, and improve site stability.