


What is a Heatmap?
There are many ways to analyze the behavior of users on the site, which are very useful in digital marketing. One of these ways that can be very useful is Heat Map. Site Heat Map is a graphical representation of data in which values are displayed in various colors. In general, it can be said that a .heatmap is a way to understand how users interact with your site. Heatmaps are a powerful way to understand what users are doing on your website pages; Where they click, how far they scroll, what they look at or what they ignore. In this article, we will try to familiarize you with the heat map or the heat map of the site and its uses. So continue with the text.
What is Heat Map?
A heat map is a graphical representation of data that uses a color coding system to display different values. Heat Map is used in various forms for analysis, but is mostly used to show user behavior on web pages. A website heatmap is a visual representation of how visitors interact with each element on your website. This shows which section gets the most clicks and grabs your visitor’s attention. By testing how certain buttons and elements are placed on your website, heatmaps allow you to evaluate your site’s performance and increase user engagement and retention.
History of Heat Map
Is heat mapping a new topic? The answer to this question is no. The subject of heat maps was noticed in 1879 by a French researcher. This researcher studied the stopping of people on certain words and that people pay more attention to some parts and simply pass over some parts. In 1980, this method was used to check people’s attention to advertisements. Therefore, the use of this method caused newspapers and magazines to change designs for more efficiency. After that, the heatmap became more popular among people and gained many fans.
How to Use a heatmap to analyze your site?
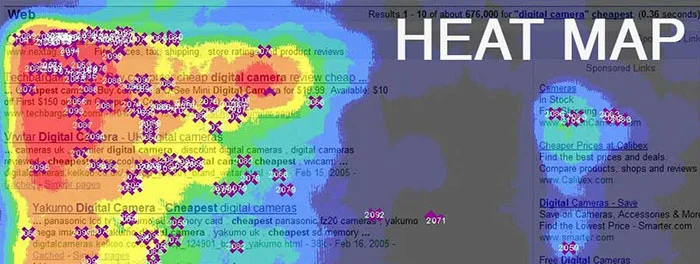
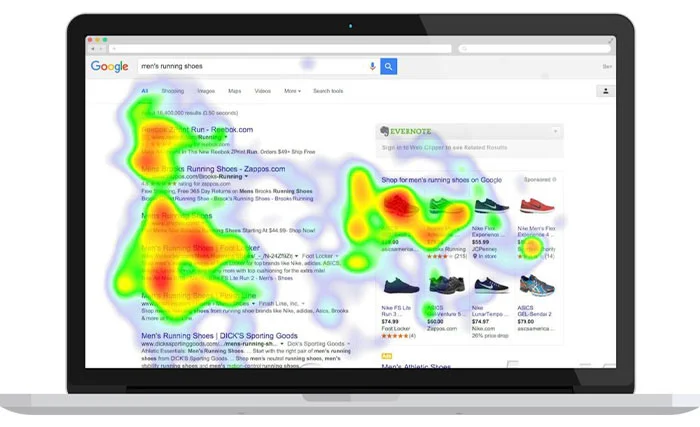
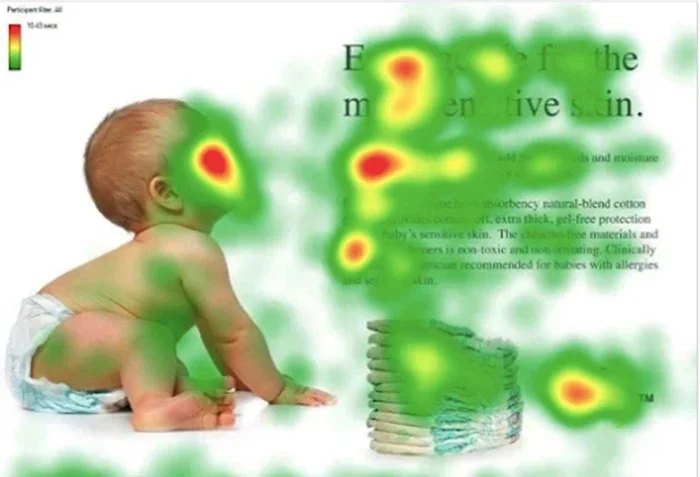
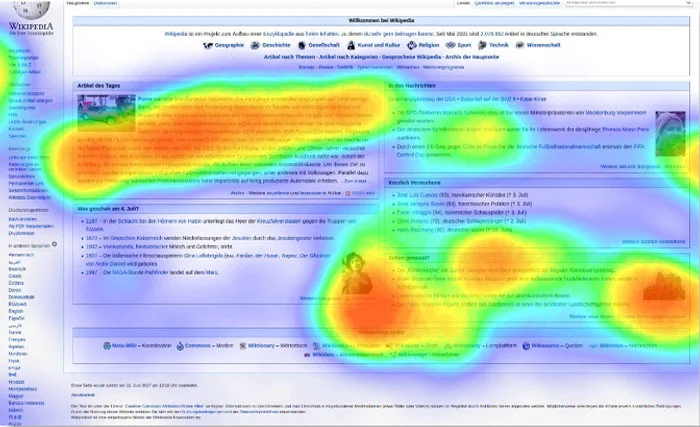
Site heatmaps depict the most popular elements (using warm colors) and the least popular parts (using cool colors) of your website page. Analyzes your website page content using colors on a scale from red to blue.
The question is, who uses heatmap? Heatmaps are perfect for marketers, digital and data analysts, UX designers, social media professionals, digital marketing consultancies, and anyone who sells anything online.
Heat Map shows a deep insight into the behavior of people on the site. By collecting user behavior in different parts of the site by heat maps, data analysis becomes much easier. By showing how users interact with your site, according to which part they click, which parts they pay more attention to, or which parts they ignore, the process of optimizing the site and product page for More interaction and sales help.
Using these maps will help you understand why users are not using calls to action or CTAs and contact information or forms. You can convert users into customers by viewing this map and making small changes in the placement of elements.
Applications of heat map
Now that you are familiar with the concept of heatmap, in this section,
we want to introduce you to the applications of heatmap. Of course, Heat Map has many uses, all of which can help you improve your site and make more sales and clicks. To learn about these useful applications, continue with the text.
Understanding the purpose of users
One of the important uses and benefits of heatmap is to know how users behave on your website. By knowing this information about users, you can do better and more efficient future activities of your site. By looking at the heat map, you can understand which part of the site has engaged the users the most, or which part of the site is not attractive to users and they have passed it without stopping. You can also find out which part of the page most users leave.
Find the right website layout
If you’re a designer, you’ve probably tried hundreds of designs for your website. The worst part is that you are still not 100% sure that the final layout is perfect. Heatmaps will easily solve this problem for you. Heatmaps help you see where visitors click the most and where they don’t click at all. Using this information, you can change your website design identify important elements, and optimize the site design to get the most feedback.
Choose a single goal
Sometimes we put more than one call to action (CTA) on our site and confuse our visitors. For example, you might have added a winter sale along with a product catalog and a free consultation ad for visitors on the same page. With the help of heatmaps, you can identify which CTA gets the most attention and make it your main target.
Remove distractions
Another important reason to use heatmaps is that heatmaps tell you if your visitors are clicking on non-clickable elements, images, and white spaces. Are users missing areas to focus on? This information can generally affect the amount of user feedback with your website; Because it helps you remove unnecessary elements, add links where needed, redesign white spaces and direct visitors to the right places.
Helping to optimize the landing page
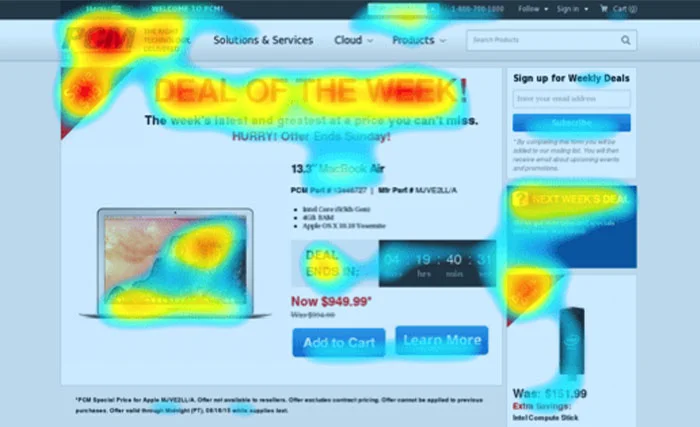
Among the factors that are important in optimizing the landing page or the login page, we can mention how to place the tags related to the title, optimal use of empty spaces, etc. The most suitable and common method for landing pages is to use CTA or the same call button. CTA evaluates the click rate of users and audiences. Using heatmaps, you can easily determine whether the CTA placement on the page is correct or not. You can find the most suitable place for the call button.
Optimizing images on the page
Another use of heatmap can be mentioned to optimize the images on the page. By analyzing this section, you can increase the focus on important elements.
Improving the strategy of internal links
Considering that the sitemap provides you with the necessary information about where users are clicking, you can determine the best place to place links to increase traffic on your desired pages.
Other applications of site heat map
Information and data related to the heat map of the site will help you to make better decisions about the arrangement of elements on the page. By using heatmap, you can place the important elements of your site in the most visited places to reach your goal sooner. So, using heatmap information will undoubtedly help you a lot in improving and optimizing your site. You can see where to place ads, cart and payment buttons, special offers, etc. so that they get the most clicks.
Creating a suitable structure for customer guidance, helping to determine the optimal number of words, answering questions in Google Analytics, etc. are other good uses of heatmap. Heatmap is also very important in the design of applications. You can design the best and most optimal application by using the heatmap and identifying the points that are most important.
Different types of heatmaps
There are different types of heatmaps, each of which has different uses. In the following, we will examine the types of heatmaps along with their applications.
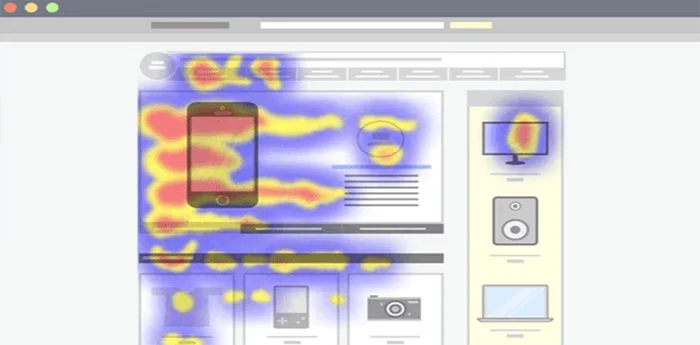
- Mouse movement tracking heatmap (Hover Maps): One of the most famous heatmaps is mouse movement tracking. As its name suggests, this heatmap will show you information about the movement of the user’s mouse on the screen. With this information, you can identify the parts that are of most interest to users and place advertising banners and important elements in these parts.
- Heat map related to movement (Move Maps): The heat map of Move Maps shows you in which parts the users had the most pause while moving on the screen. This information shows that users focused more on these parts and found them more attractive.
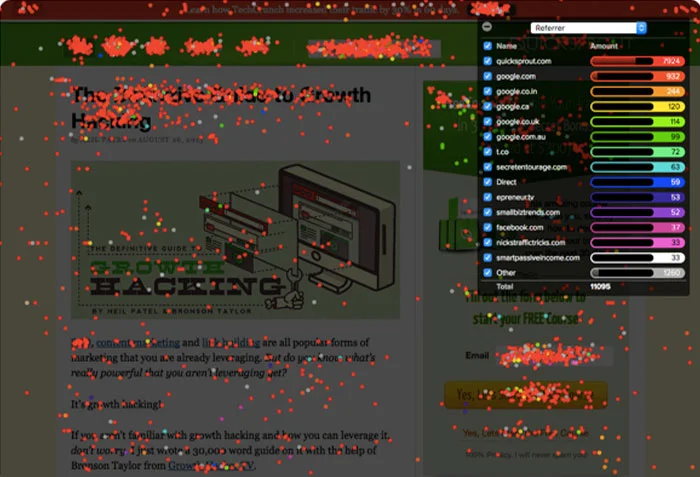
- Click Maps: This type of heat map shows you information about the number of clicks by users. You can identify the most clicked sections. Using this heat map, you can identify which of the advertising banners or titles or any other elements were the most popular.
- Scroll Tracking Heatmap (Scroll Maps): These types of heatmaps show you how far users have scrolled on the page. A scroll map can be very useful when you want to decide where to place key website elements such as links, videos or any CTAs. The longer the page, the fewer users will see it. So try to place important elements at the top of the page.
- Attention Maps: Attention maps consist of a combination of horizontal and vertical scrolling and the amount of time the user stops in that area. The time criterion is the most important point of this heat map.
Tools for creating heatmaps
So far in the text, you have familiarized yourself with the concept of heat map and its applications, as well as the types of heat maps of the site. Now, one of the most common questions is what tools to use to create a heat map? In the following, we have introduced 4 tools and sites for creating heat maps.
- Hotjar site: One of the most famous sites for creating heatmaps is Hotjar site. Registration and use of analysis tools of this site is free. To use this site, you can add your website after registration and then click on Add Heatmap in the dashboard. After that, select the desired page and click on Create Heatmap option.
- Crazy Egg Tool: One of the most popular tools for creating heat maps is Crazy Egg. You can get click, scroll and movement heatmap with this tool. This tool is not free to use and you have to pay $29 to $99 per month (depending on the type of service provided).
- Heatmap Tool: One of the simplest tools for creating a heatmap is the heatmap tool. This tool is easy to install and you can use it for free for up to 6 months.
- UserHeat tool: Another tool for creating heatmaps is UserHeat tool. This tool is available for WordPress sites by installing this tool plugin for free.
Conclusion
Heatmaps display complete and good information about user behavior on site pages. Therefore, you can use this information to optimally and functionally design the layout of site elements, links, advertising banners, etc. You can easily create all kinds of heatmaps using the tools mentioned in this text and take advantage of its useful information.