


Step-By-Step Tutorial On How To Normalize Data In SPSS + Videos
Due to the fact that many friends have difficulty discussing data normalization, so in this article we want to teach you how to normalize data in SPSS in a visual and step-by-step manner with full explanations.
Normalizing or normalizing data in SPSS is a little more time consuming than the other commands mentioned in this software. For this reason, a PDF of this tutorial is also available for download.
How to test the normality of data with spss (video):
What is the purpose of data standardization?
This is a question that many of our compatriots ask what is the use of data standardization? The answer is that data standardization helps that their importance does not depend on their unit of measurement. As a result, standardized data is used in cases such as data mining and multivariate data analysis.
Standardization is also applicable to quantitative and qualitative data, and there are several standardization methods.
Step-by-step tutorial on normalize data in SPSS:
After watching the video above, we will go to the step-by-step instruction of this operation. You can follow these steps in order to complete the data normalization easily and successfully.
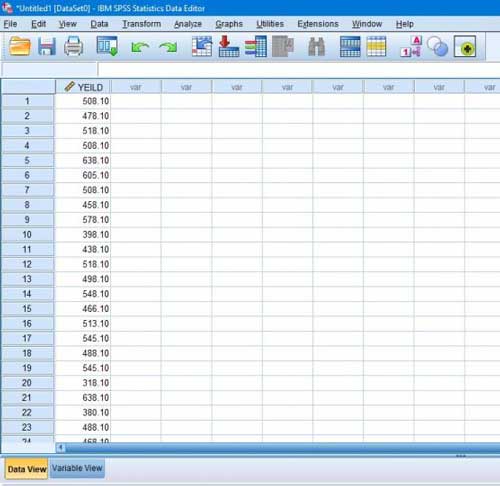
Step 1- We enter the data into the SPSS software environment . In this step, the data can be entered manually or copied from another environment such as Excel.
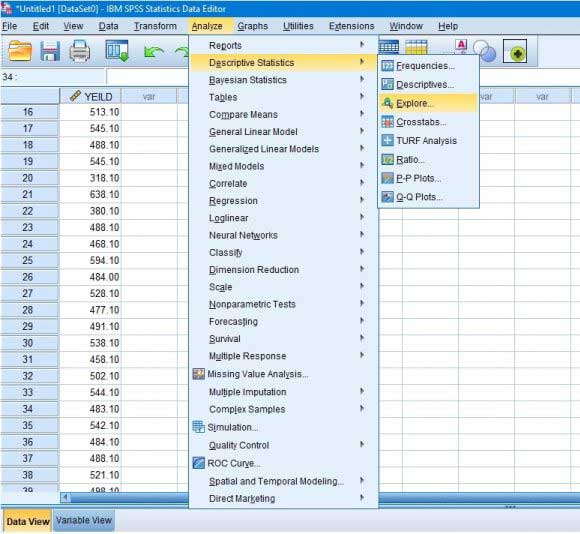
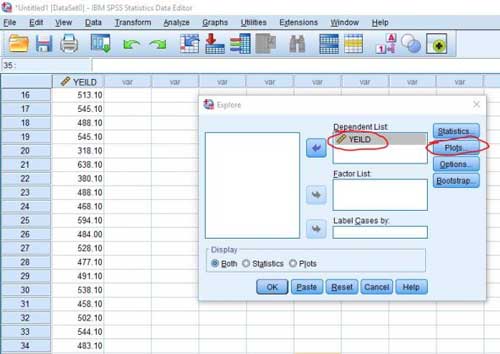
Step 2 – After entering the data, go to the Analyze tab and enter the Descriptive Statistics and Explore sections .
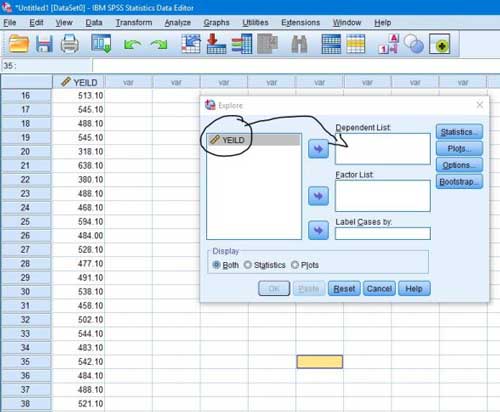
Step 3 – In the window that opens, enter the desired attribute in the Dependent List box . In this step, if we have several attributes, we can perform the normality test on all attributes simultaneously, so we enter all the attributes in the Dependent List box .
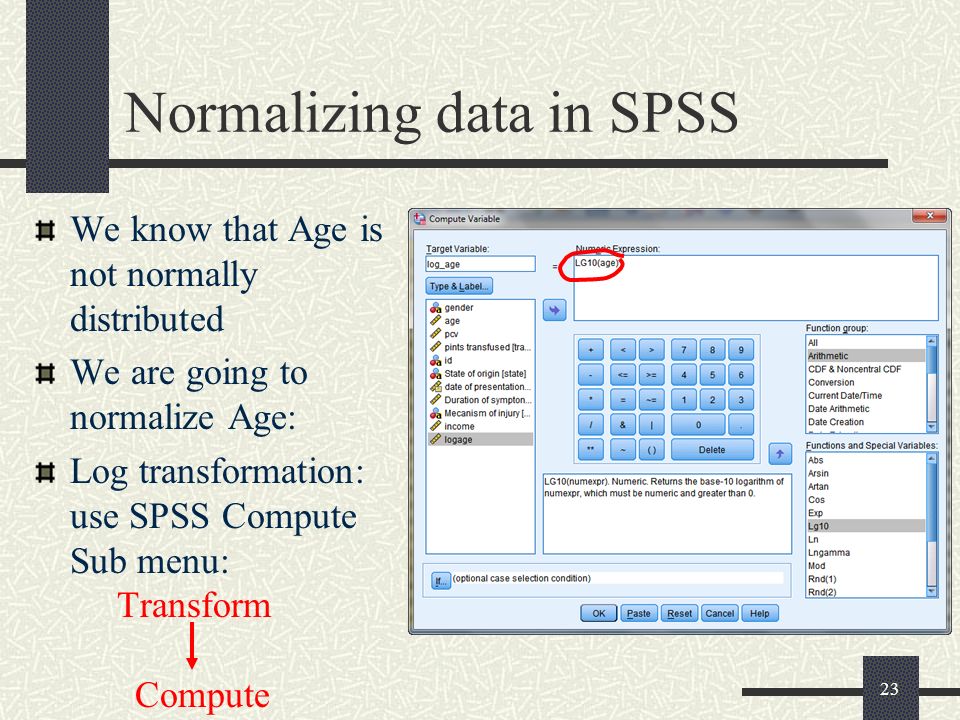
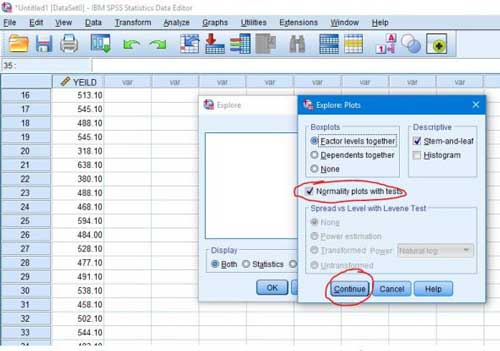
Step 4 – After entering the attributes, we must activate the phrase Normality plots with tests from the Plots section and click the Continue and Ok button so that the test results appear in the Output window .
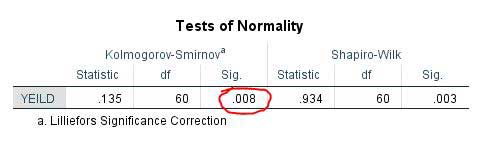
Step 5 – You saw how easily with two tests, the normality of the data was checked. Now, according to the above, we are examining the results of the Kolmogorov-Smirnov test. In this table if the value of sig . If it is more than 0.01, the data is normal, and if it is less than 0.01, the data is not normally distributed, and we must convert it before analyzing the variance.
Finally, if you have any questions or objections about this issue, let us know in the comments section.