Complete And Visual Training Of Descriptive Statistics In SPSS Software
In the continuation of the series of simple and attractive SPSS tutorials, we will go to the complete training of descriptive statistics in this software.
This tutorial shows you how to use SPSS version 2017 to analyze exploratory data and descriptive statistics. You to create bar charts, frequency distribution, stem and leaf drawing, box diagram drawing, standard calculation of central orientation criteria (mean, middle and mode), standard calculation of dispersion criteria (amplitude, distance between first and third quarters, muffler deviation, variance) ) And you will use SPSS to calculate distribution and uneven curve criteria.
Instructional video
This video provides an overview of SPSS descriptive statistics that you should watch before reading the rest of the post:
Frequency commands
Frequency orders can be used to determine quartiles, percentages, central indices (mean, median, and mode), to measure dispersion (amplitude, standard deviation, variance, minimum and maximum (distribution curve and unevenness criteria), and to create bar charts. This command can be found in Analyze | Descriptive Statistics | Frequencies (this is a shortcut to click on the Analysis menu items at the top of the window and then click on the descriptive statistics from the drop-down menu and frequency). Frequencies from the pop up menu)
The Frequencies dialog box will appear:
Select the variables you want to analyze by clicking on them in the left pane from the Frequency dialog box. Then click the arrow button to move the variable to the variables section:
If you want to have a periodic distribution, make sure that “Show periodic tables is displayed by clicking the statistics button to specify which statistics you want to do. The Statistics dialog box will appear:
From the Statistics dialog box, click the statistics you want to do. To calculate a given percentage, click on the percentage (s) to the left of the box. Type the desired percentage and click the add button. When you have selected all the statistics you want (e.g. average, median, mode, standard deviation, variance, range, etc.) click the Continue button. Specify which chart you want to display by clicking the Chart button. A chart dialog box will appear
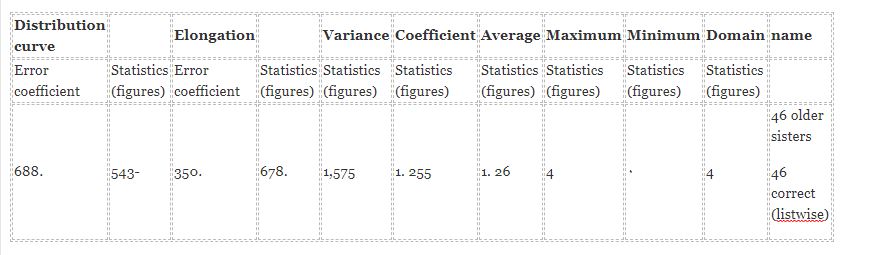
Click the desired chart (usually a bar chart) and click the Continue button. Click OK in the Frequencies dialog box. The SPSS output display will appear. In the SPSS output display, you will see the desired statistics and table. This is what the statistics output looks like. This list lists the required criteria from central orientation, scatter measurements, uneven measurements and distribution curves, and quartiles and percentages.
Statistics on the number of older sisters
| 46۰ 1. 26 1.00 ۰ 1. 255 1,575 .678 .350 -543 .688 4 .00 1.00 2.00 | valid missing Average Middle Fashion Standard deviation Variance Rugged Be standard oblique error Distribution curve Standard distribution curve error Domain Percentage of cases 25 50 75 |
The output has two columns. The left column is called Statistics and the right column gives the statistical value. For example, the average of this data is 1.26 (because your data set may be different, you may get a different value. When the distribution is broken, the degree of elongation is greater than 0. The distribution curve for A normal distribution is 0.
If you scroll down, you will see a lot of distribution.
| The cumulative percentage | Correct percentage | Percent | Abundance | |
| 3760.9 82.6 93.5 100 | 3723.9 21.7 10.9 6.5 100 | 3723.9 21.7 10.9 6.5 100 | 1711 10 5 3 46 |
1 2 3 4 total |
Bar chart
Descriptive instructions
Descriptive instructions can be used to determine central tendency (mean) measurements, scatter measurements (amplitude, standard deviation, variance, minimum and maximum), and distribution and elongation curve criteria. Can be found. (This is a shortcut to click on the Analyze menu item at the top of the window, then click on the descriptive statistics from the drop-down menu and Descriptives from the pop up menu):
A descriptive display box will appear:
Select the variables you want to analyze by clicking on them on the left side of the descriptive box window. Then click the arrow button to move the variable to the variables section
Click the Options button to specify which statistics you want to do. The option check box will appear:
Select the statistics you need by clicking on them (such as mean, standard deviation, variance, range, minimum, etc.). Then click the Continue button. Click the OK button in the Descriptives dialog box. The SPSS output display appears with your results. The following is an example output:
Descriptive Statistics
The output gives the values of the requested statistics.
Explore command
The exploration command can be used to determine central tendency measurements (mean and median), scatter measurements (amplitude, distance between first and third quarters, standard deviation, variance, minimum and maximum), distribution curve and elongation, and chart preparation Column, dragging stems and leaves, and plotting Tukey box, this command can be found in (Analyze | Descriptive Statistics | Explore):
A dialog box will appear:
Select the variable (s) you want to analyze by clicking on it on the left side of the dialog box. Then click the up arrow button to move the variable to the dependent list:
By clicking on the Plots button, specify which theme (design) you want to create. The Plots dialog box will appear:
Select the distributions you want by clicking on them (for example, average, stem and leaf, and bar chart). Then click the Continue button. Click the OK button in the browser dialog box. Your results will appear in the SPSS output display.
| 185.350. 688. | 1. 2689. 1.63 1.18 1.00 1,575 1. 255 ۰ 4 4 ۲ 678. 543- | Middle number of older sistersBottom line 95% confidence Upper boundary distance for mean 5. Decreased Middle Variance Standard deviation Minimum Maximum Domain Quarterly range Elongation Distribution curve |
The output gives the values of the requested statistics
If you scroll down, you will see the requested layout.
Bar chart
The first Tukey box diagram shown (bottom of the box) and the third (top of the box) quarters (equivalent to 25 and 75%) middle (horizontal line in the box) range (excluding unstable and extreme scores) Box Expands (concentration (a circle represents each output – the number next to the output is the number of views).
The output is defined as a score between 1.5 and 3 times the length of the box continuously from the top or bottom edge of the box.
Note that the box shows the middle 50% of the score).
The maximum score is defined as the score that is more than 3 box lengths from the top or bottom edge of the box.