


Introducing The Main And Important Components Of Spss To Better Learn The Introductory Level
In the continuation of the series of attractive tutorials of spss software , in this post you will get acquainted with 4 important concepts.
IBM SPSS statistical software is used for data management and extensive statistical calculations. This text is intended for those students who are taking courses that use SPSS software or anyone who is new to the software.
People who want to do research projects using SPSS should follow this brief introduction and practice more.
For more information on SSCC Laboratory Accounts, Labs, Winstat, and more, see the information required for SSCC Structural Laboratory users. SPSS software is written according to SPSS programming language.
The good news for beginners is that they can do most basic data analysis through menus and exchange boxes, and there is no need to learn the SPSS programming language; These tools are very useful, because they use visual reminders for you and to do what you want at every step.
However, some operations cannot be performed through menus, and as a result, it is much easier to do so by typing multiple keywords instead of using long menus and boxes.
As a beginner, it is better to know part of both the programming language and the menus.
In the long run, you will only be interested in getting things done directly through the programming language, as this is the way you can document your work, and good documentation is the key to troubleshooting and replicating complex projects. Now we assume that you want to do simple things.
General introduction video of spss software
The video was prepared by my dear colleague Mr. Moazen. Now read the rest of the article.
Launch of SPSS statistical software
SSCC has installed SPSS software on lab computers (4218 and 3218 Sewell Consensus Building) and some Winstats computers . If you are using a computer owned by the university, you can log in to the DoIT School software library and download and install the SPSS software (this also applies to NetID and supervisor permission).
To run the software, enter from the following address: Start – IBM SPSS Statistics 23 -IBM SPSS Statistics – Programs. When you first open the software, a window will open asking you to open the file; This file can be one of the recently opened files from the list on the left or in another folder.
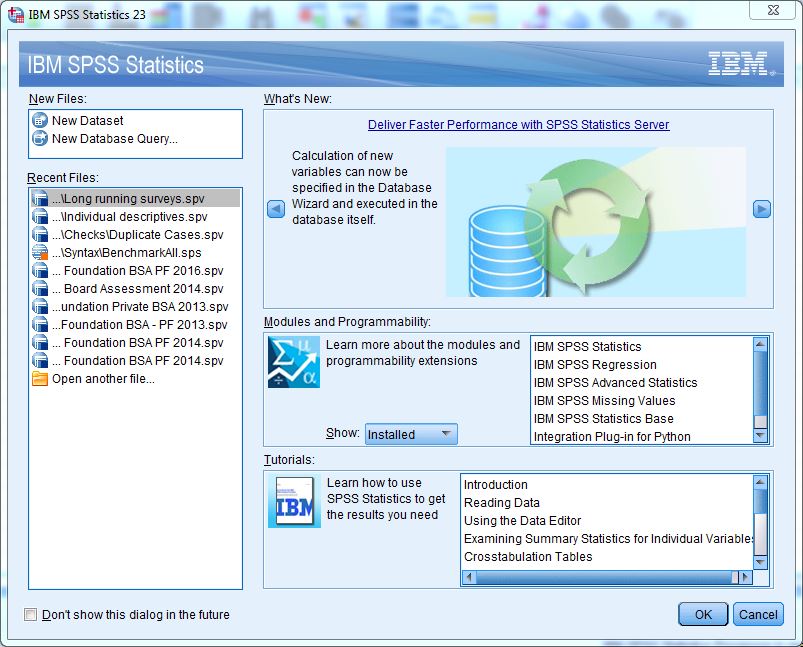
Basically, you start your SPSS job by opening the data file you need to work with.
SPSS files and windows
This software has three main windows plus a toolbar at the top. These tools allow you to (1) view your data, (2) view your statistical output, and (3) view any program commands you have written. Each window belongs to a separate type of SPSS file.
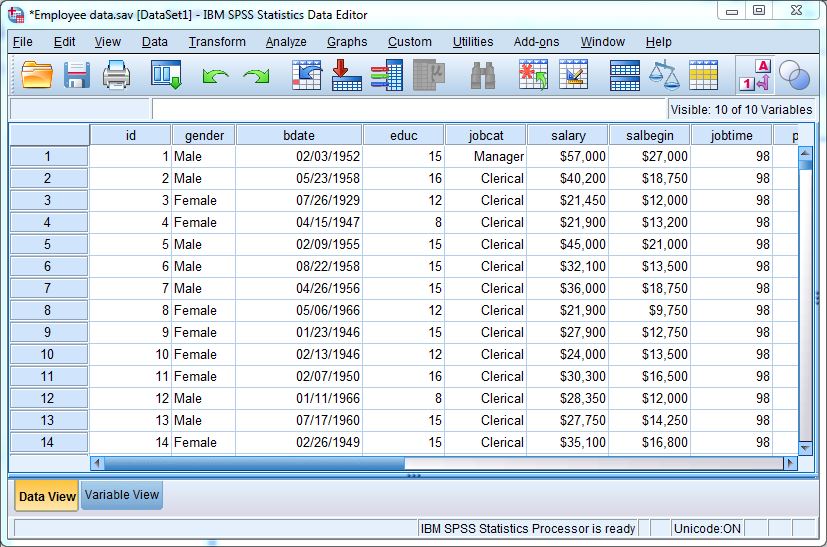
Data Editor (.sav)
This section allows you to view and change the data. At least one data editing window will always be open (even if you have not opened the dataset). When you open a SPSS data file, what you see will be an active copy of your data. The changes you make to the data will not be permanent until you save it (via the File – Save or Save As menu ).
The data is stored in .sav format, which other software, for the most part, can not open. When you close the latest data editor, it means closing the software window and you have to save everything that is not saved.
To open another data file, go to the File – Open – Data menu . (This way you can open other types of non-SPSS data such as Excel, Stata, or SAS). This software allows you to open multiple data files at the same time and mark the window you are working on – the active window – by placing a red “+” on the title bar.
In order to prevent clutter, it is best to close each data window after it is done.
Output view window (.spv file)
Just as SPSS is required to perform different computational tasks and other tasks, results can also be displayed in different locations. New data values are displayed in the data edit window. The statistical results will be placed in the output window.
The output window displays a table of statistical outputs and any graphs you have created. The error will also appear here. At this point you can edit and print your results. The viewed output tables (via the File –Save or Save As menu ) are saved in .spv file format and can only be opened by the same software.
Like the edit window, more than one output window can be opened here; The active window with a blue “+” sign in the title bar contains the results of each command you execute. If you close all output windows and run a new command, another window will open.
Edit combinations and commands (.sps files)
If you are working directly with the programming language, you will also open a command editing window.
This window allows you to write, modify, and execute commands. If you are using a menu or window, the Paste button automatically writes the command you specified in this window.
These files are saved as plain text and can be opened by almost any text editor with the .sps text plugin. Like other windows, you can have several windows open at the same time, and the active window is indicated by a small orange + sign. When you move a command from the Exchange boxes, it will be moved to the active edit window.
If you close all windows, another window will open if you try again.
Implementing commands
If you do not give any instructions to SPSS, the software will not do anything. In general, commands are executed either through menus and exchange boxes that trigger the behind-the-scenes programming language, or directly by writing commands in the commands editing and executing window.
Exchange boxes
Although each box is different, they have something in common. A common example would be the production box of many tables (tables with numbers and percentages). To display this box, use the following menu:
Analyze – Descriptive Statistics – Frequencies
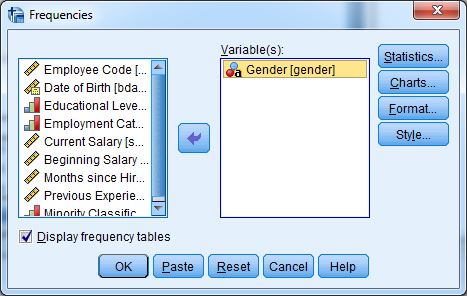
On the left, there is a list of variables with all the variables in your data. If your variables have tags, what you see will be the beginning of those tags.
If you want to see the full name of the variable (in parentheses), hover your mouse pointer over the top of the labels. Select the variables you want to analyze by clicking (you may have to scroll up or down the list). Then by pressing the arrow to the right, the variable will be added to the list to the right and analysis.
If you change your mind about a variable, you can select it from the list on the right and remove it from the list of analytical variables by pressing the left arrow.
At the far right, there are buttons that open a number of other windows related to frequency commands. Press the OK button at the bottom of this window, send your command to SPSS, or press the Paste button to move the written commands to the command edit window.
If you go back to the window, you will find it as you left it last time and with the last commands executed. This will be very useful for you when you are testing multiple variables in your analysis or debugging. If you would like to start over, you can use the Restart button.
Work with data editing window
The main use of the data editing window is to display (part of) the amount of data you are working with. Also in redefining the properties of variables (changing data type, adding tags, missing data values, etc.), creating new variables and manually entering data.
The data editing window gives you two points of view of the data set: a view of the data and a view of the variable, which is obtained by clicking on the appropriate tab in the lower left corner of the window.
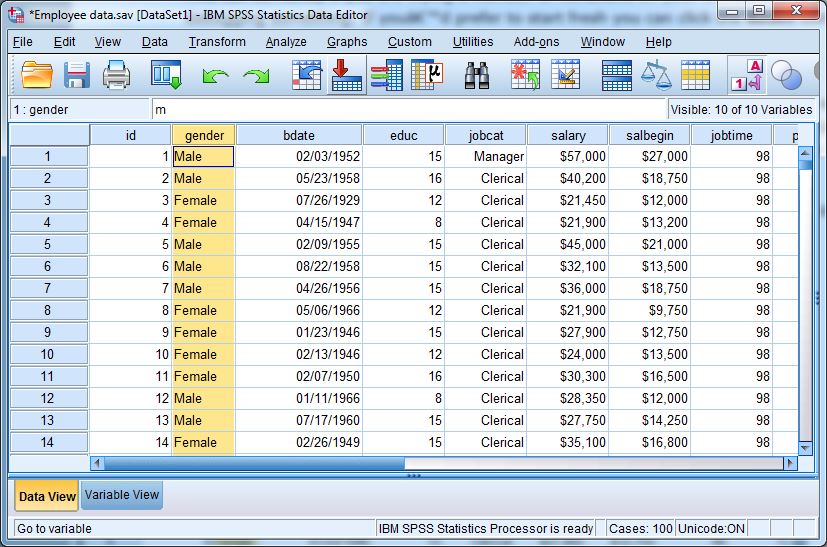
Display data
In the data display, the data is displayed in the standard rectangular format of statistical software. Each row represents an observation unit, sometimes called a record or, for example, SPSS, for example.
The number of samples (views) can be seen in the left column, which is assigned automatically and will not be saved as data. Each column represents a variable. All data in a column must be of the same type, whether numeric or string (also expressed as a character).
Each data cell contains data values. If the data in each cell is missing, it is displayed as a dot (“.”) Or blank (“”). ]
Data values can be in the form of actual values or modified values.
For example, a person’s income may be $ 15,000 or a modified form of $ 15,000. Formats can also be in the form of quantitative labels; for example, data recorded in Figures 1 and 2 can be labeled as male or female.
While data formatting makes it easier to interpret the results, we need to keep in mind that what SPSS actually processes is the amount of data. Especially when a command requires you to specify one or more data values, you should use values, not modified forms.
You can switch between transformed and unformatted data by clicking on the Value Labels button in the toolbar, the fourth button on the right in the displayed mode. With the value tags on, you can also see the actual values of a variable by clicking on a cell and looking at the top row.
The box (house) to the left represents the number of observations and the selected variable, for example 1. Gender, if the center box shows the actual value, for example m. Data values can be added or modified using direct writing in the data display.
To add data, write the actual amount of data at home. However, except for very small datasets for the class, you almost never do that.
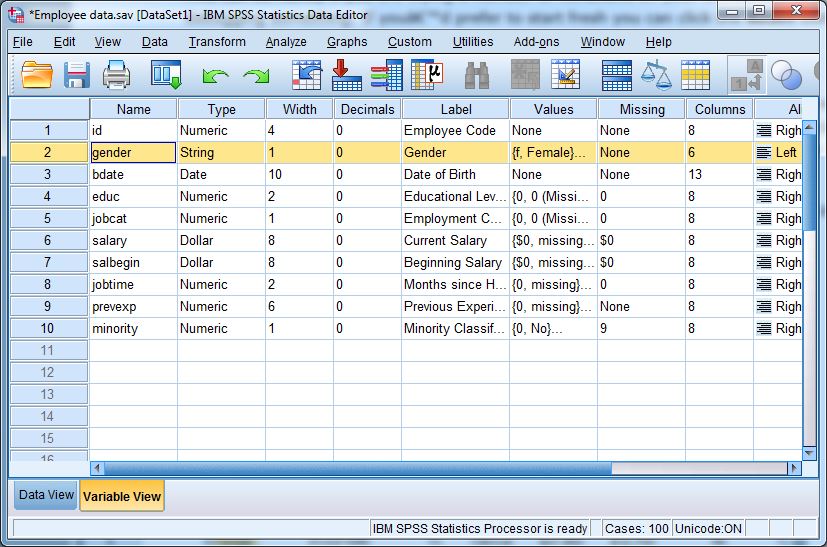
Variable display
In the variable view, you can view and modify the identifying information of each variable (sometimes called metadata) in your data set: Each displayed column is described by a line of the variable display.
The first property of any variable is its name. Variable names represent how data columns are identified in the programming language, and in order for the programming language to function properly, variable names must follow certain restrictions: Letters must start with a letter, preferably letters, numbers, and symbols.
Do not use punctuation and punctuation. Uppercase and lowercase letters do not cause a problem. Variable name lengths can be up to 64 words. These letters can be easily modified or created by writing in the boxes.
Among the types of basic variables, we can mention “number” and “string”. What only makes it more difficult, however, is that SPSS allows you to select different standard formats for displaying digital data (for example, scientific notation, comma, currency), and calls it Type.
Type the variable by clicking on the column and then clicking on the gray button and continue working in the exchange box.
The tag feature allows you to create a longer description of what is seen in the variable name location similar to the data tag for data values. Both variable tags and value tags help us provide more understandable outputs.
The Values feature allows us to create a list of value tags. Usually different variables share a common set of value tags, and you can copy and paste this set. You can easily specify these tags by typing them and they work through the exchange window.
The Missing attribute is a place for you to specify the amount of data you do not want SPSS to take into account when making statistical calculations. For example, in interview data, it is common to use the number 8 in response to an interviewee who says “I do not know” in response to a question, and you can program SPSS to use 8 in a variable. Mention it as missing data.
Other features include Width, Decimals, Columns, Align, Measure, and Role, which have minor adjustments to the display. Although scale (measurement level) is a statistically very important concept, it has little meaning in SPSS software.
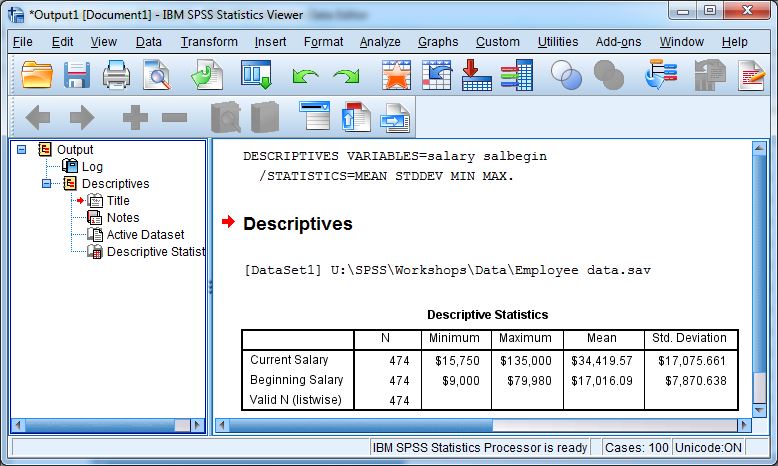
Work with output display
Displays output, statistical tables and graphs and allows you to change them before saving and printing. The output view is divided into two main sections, the context section (summary) on the left and the tables section on the right. The part we will have in print will be the tables section.
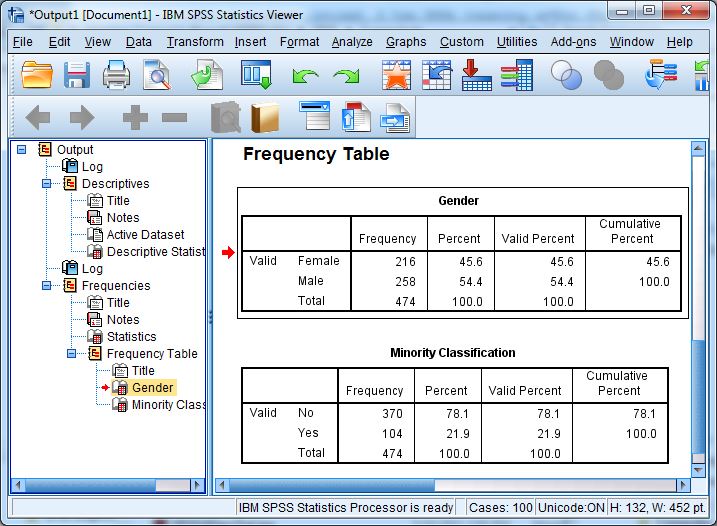
When SPSS generates an output (tables, commands, error messages, etc.), it adds them to the tables section as objects and each item is displayed in the output.
Any item can be opened and modified, deleted, hidden, re-arranged or printed. To work with any item, you can select it by clicking on the tables section or by clicking on the corresponding entries in the field section. A red arrow appears on both sides of the case.
To edit (edit) items, click on them in the Double Tables section.
Depending on whether you are editing a simple item such as a title (which contains only a cell with some text in it) or a more complex item such as a table or chart, you may be able to easily modify it in the output window or open windows.
Aside from changing the appearance of the chart, it is easier to move your output to Microsoft Word first, but in principle you can change everything you see in the output to delete columns or change numbers. (But if you want to simulate your results, it is better to refer to our simulation workshops for better methods).
To delete items, select them in each section and click the Delete button. To hide the items, double-click on the image icon of each item in the background section. Double-click on it again to reveal it.
You can hide an entire section by clicking on the negative sign to the left of the group in the context field. These hidden sections will not be identified in print, but will be saved along with the other sections.
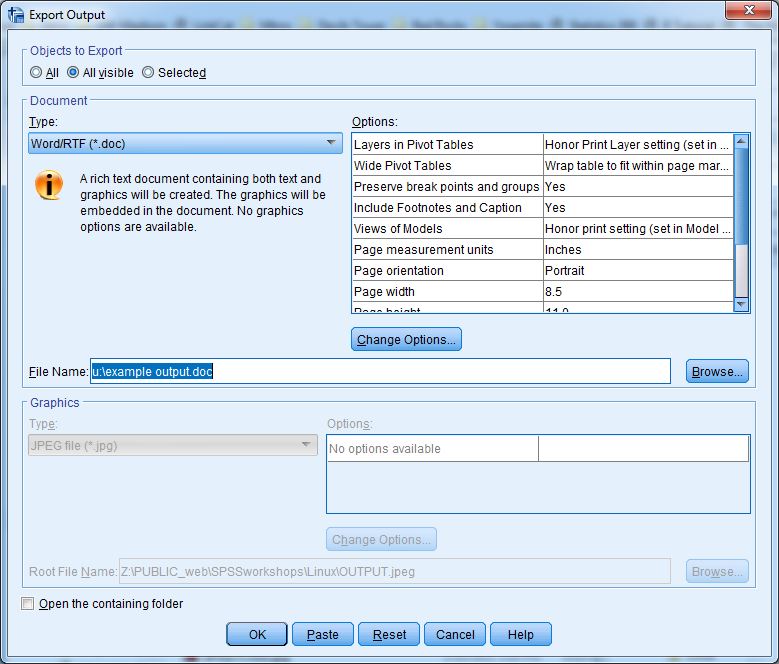
To rearrange items, select the desired item (or group of items) in each section, and drag them until the red arrow appears below the ones you want to appear. You follow a certain procedure to get the output from the output. In the output view, click on File – Export to display the corresponding window.
Consider three basic things.
Well, the type of file you want to output this way: Useful types include Excel, PDF, PowerPoint, or Word.
Then check that you have everything you want using the Objects to Export buttonTake the output at the top of the window. If you have selected only part of the output, this option will present only that part as the output by default, otherwise it will present all the specified output as output.
Finally, select the file name meaningfully and save it to an address you can save, such as U: \. Click OK when your selections are set.
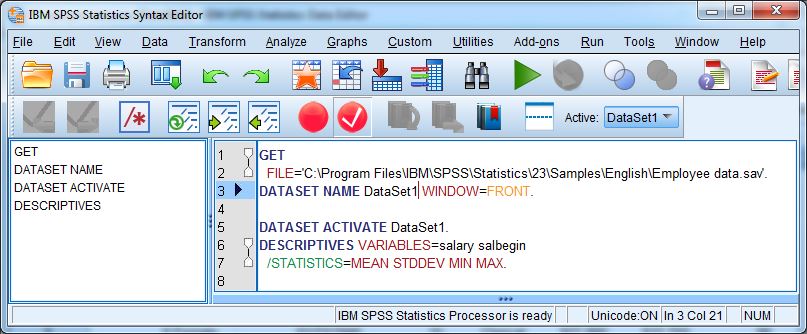
Work with the command editor
Learning SPSS programming is a separate subject; Its principles were presented in the SSCC workshop. But in order to enter and execute an SPSS command, you do not need to memorize a new language. The basic unit of work with a programming language is grammar: look at grammars in well-formed sentences.
In this language, commands start with a keyword and end with a period. Commands should start in the leftmost column of the editor. If the command is long and more than one line, the second line and the continuation of the command must start with a space.
It doesn’t matter how small or large the letters are. SPSS turns commands it can not read red.
Similar to the output editor, the command editor has two sections. The tables in the right section are actually what is saved as a .sps file.
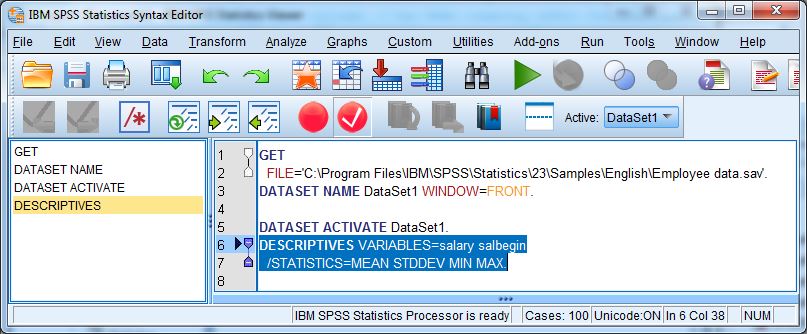
Execute the command. In order for SPSS to actually execute your command (s), you must run them. Click the Run button and then one of the menu options.
There is also an icon in the toolbar to run your program, a right-hand triangle (“play”). You can edit all the commands in the window, or select only some of them, just run them (or have the entire command, from the first keyword to the endpoint). You can also run the current command, which is what the mouse pointer is on.
Patch and run. Instead of just executing commands, it is possible to patch most exchange boxes. SPSS then writes the corresponding command in the data editor window.
The written command will be detailed in principle and will indicate many of the default options. The command you write will be much shorter and simpler. After entering the command after copying it, we still need to execute it to get the output.
Learn more
To learn SPSS professionally, use these wonderful educational and standard packages to learn it very quickly, easily and without the need for a class.
To learn more about the SPSS user interface, you can read the online software training that comes with the software by clicking on Help – Tutorial .
Also click to see our practical and attractive educational articles about SPSS . Your instructor and / or assistant professor can also be your best source for your class assignments.