
Unlocking Website Performance: A Comprehensive Guide to GTmetrix Analysis
Has it ever happened to you that you leave a site because of slow loading speed and don’t wait for it to load completely?! If yes, then you also know the importance of a site’s speed. In today’s fast-paced world, speed and quality are two elements of success, so if you have one or more sites online, you should pay attention to their speed, among other factors. GTmetrix is one of the essential tools in analyzing a site’s speed, which helps you have a more powerful and faster site. Join us to learn more about this practical and important tool in this article.
What is GTmetrix?
At the beginning of the article, we want to know precisely what GTmetrix is and what it does. As mentioned in the introduction section, currently, site speed is one of the most important and influential factors in a site’s SEO and even technical SEO. If the loading speed of your site is low, users will soon get tired of it and leave it. Therefore, the rate of visiting the site, interacting with it, the time users stay on the site, and other factors will decrease drastically. Therefore, in order to improve your site’s SEO, you should pay a lot of attention to this important factor, i.e., loading speed.
GTmetrix is one of the most valuable tools in site speed analysis. It finds speed-related problems and provides solutions to solve them. This tool was provided by two big companies, Google and Yahoo, and so far, many big and small sites around the world have used it. A site’s speed varies according to different factors at different times.
According to the number of visitors and traffic of the site, the time of using the Internet, the use of the server box in case of shared hosting, and other reasons, the loading speed can be different on a day or a week. This tool focuses on the average rate and the overall speed of the site and analyzes it.

Is GTmetrix the same as PSI?
If you are active in the web world, you are probably familiar with PSI, which is another tool for site speed analysis. Many people consider these two tools to be the same, although they are very different from each other, despite their everyday use. One of the most critical differences between GTMetrix and PSI is that PSI uses simulated browsers to test the speed of a site, but GTmetrix uses real browsers. Therefore, the analysis results with the GTmetrix will be more accurate compared to PSI.
Another difference between these two tools is that PSI is geographical, that is, it examines a site based on its geographical location, but GTmetrix has seven regional test servers and international testing. This means that your site’s speed can be checked from different regions of the world.
What are the uses of the GTmetrix tool for the site?
In the above sections, we learned about this speed test tool in detail. Now, we want to know what exactly this tool will provide for our site.
- This tool is one of the most powerful and accurate tools for testing site speed.
- It identifies the problems that cause slowdown and offers solutions to fix them. It also allows you to easily run the provided analytics in your WordPress dashboard.
- It is a tool for analyzing site performance.
- Points are considered for different pages of the site, and you can work on each page individually.
- It allows you to schedule detailed reports daily, weekly, or monthly.
Application parts of the GTmetrix
This tool performs analysis in three different categories to measure the speed and performance of your site. These three categories include the following:
- Provide vital statistics for the site
- Ranking and rating the site
- Expert analysis of different parts of the site

Provide vital statistics for the site.
In 2020, Google introduced a new concept called Web Virtual and provided various criteria to check the pleasantness of the user experience. This metric helps site administrators to evaluate the user experience in terms of loading, interaction, and enjoyment. By using this tool, site administrators can understand what attracts users’ attention and what is loaded for the first time when users enter their site for the first time. To provide vital statistics, GTmetrix examines several essential factors, which we will learn about later.
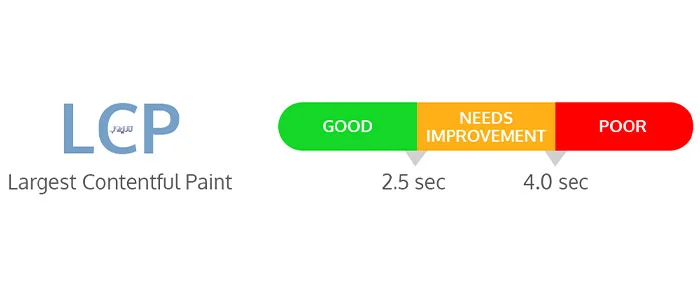
LCP invoice
This factor was first used by Google and LiteSpeed, and only a short time later, GTmetrix also used it to check the speed and user experience of the site. This factor is one of the most important SEO factors in the performance report and accounts for almost 25% of it. This factor examines the loading time of the largest content of a site. Of course, there are other definitions for using this factor; for example, GTmetrix uses it to check the loading time of the content that is in the upper half of the site.
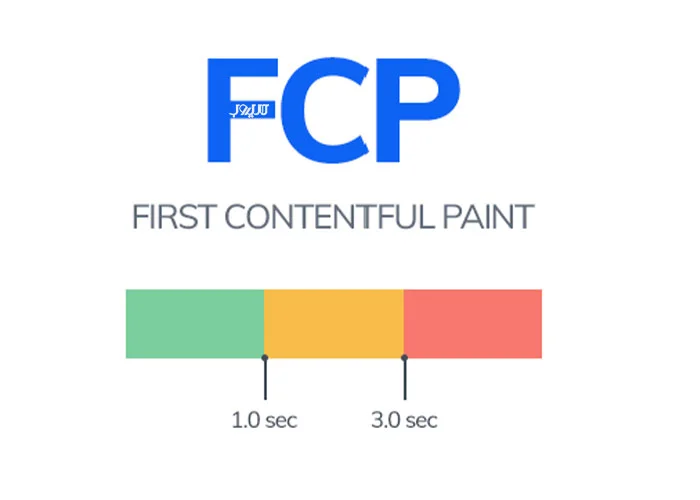
FCP invoice
This invoice means the first thing that is displayed to users. When a user enters your site, a request will be sent to the server from the browser. The server checks the requested content and displays the content the user needs. The first content displayed for users before this stage is an existing background that has nothing to do with the type of requested content, and is displayed for all users and all requested content. This background can be any color, depending on the design.
The first stage is called First Paint. The second stage is the stage of displaying other content sent by the server, which is called First Contentful Paint. The final stage is the stage of fully loading the page, which is called Fully Load. To optimize the speed of a site, you should try to make the LCP and FCP factors as little different from each other as possible.
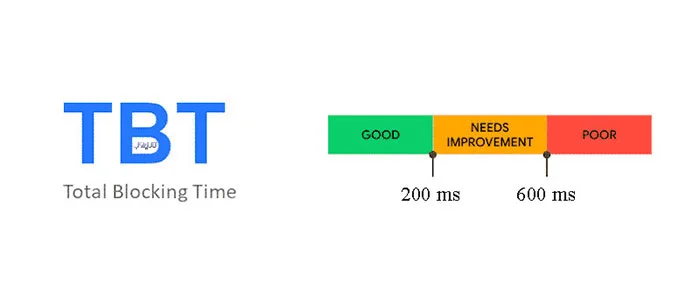
TBT factor
Another important factor in GTmetrix measurement is the TBT factor. This factor means the duration of blocking and is used to measure the level of user interaction with the site. Simply put, this factor is the time it takes users to load a page, the site deals with the problems of CSS and HTML files and building the DOM, and finally, to show the end result to the user. If this factor and its duration are high, you will likely lose most of the users and visitors of your site.
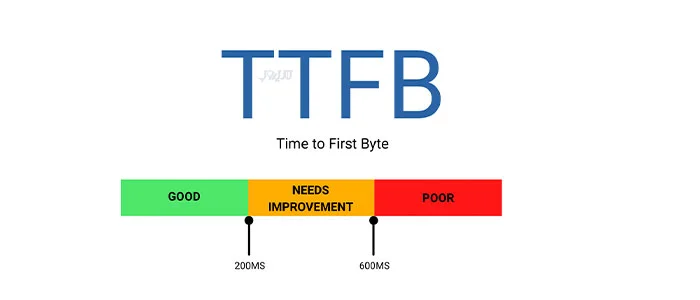
TTFB invoice
This factor, abbreviated as Time To First Byte, means the time it takes to receive the first byte. In fact, from the beginning of the user’s request to load a page until the first byte is received from the server, it is called TTFB, and the site SEO officer should try to reduce this factor as much as possible.
Ranking and rating the site
GTmetrix also allows you to rank and score your site based on LightHoss factors. This means that the statistics that GTmetrix will give you will be exactly the same as the LiteHus system. This tool has recently added new factors and features to its capabilities that have multiplied its popularity and usage. Site ranking by this tool is done in the following three ways:
- Score site structure
- Site performance score
- A score given in alphabetical order.

Expert analysis of different parts of the site
Another important section of this tool shows you some of the site’s problems in a specialized manner. You will also be provided with solutions that you can use to fix problems and optimize your site.
How is the site scored by GTmetrix?
This tool will show you the score of your site in the form of percentages and colors so that you can have a better understanding of the conditions of your site. For example, if the tool turns red, it means that your site’s optimal performance and speed are below 50%, and you should improve it quickly. But besides the factors mentioned above, what other things does GTmetrix consider for site ranking? The most important of these factors include the following:
Speed index
One of the important factors measured by this tool is the speed index. This factor examines the site’s completion and loading time frame by frame and evaluates the speed index based on its loading speed. One of the main differences between this factor and the FCP index is that this index has nothing to do with the execution of the content and is related to the size of the browser’s image input. This index will have a 10% impact on the final result of the GTmetrix.
Interaction time
Another important factor used in site speed evaluation is site interaction time. This factor is when the user has fully entered your site and the site has been loaded. When the user clicks on an icon, the interaction time or ITT is the time it takes for the user to perform the desired action. It is natural that the shorter this time, the more pleasant the user experience. If this time takes longer than the standard value, the user will probably give up and leave the page. This factor will also affect the final result of GTmetrix by ten percent.
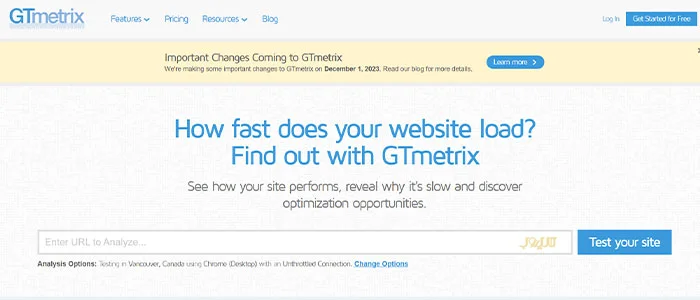
How to log in to GTmetrix and use it
If you are also interested in using this tool, it is very easy to use. To access this tool, just go to WWW.GTMetrix.COM and enter your site address in the desired section. Select the Analyze option so that your site will be analyzed by this tool. A window will open showing the results of the analysis in two parts: Grade GTmetrix and Web Vital.
GTmetrix Grade section
In this section, you will be given three different points.
The first part shows the site score based on the alphabet from A to F, and the three colors green, orange, and red. A grade and green color indicate the best score, and an F grade and red color indicate the lowest score.
Performance score
This score is given when users enter your site and examine various factors such as the loading time of the first content, index speed, blocking time, and loading time of the largest content. In the above sections, we got acquainted with each of these factors.
Structure score
This score evaluates the optimality of your site. Fixing the errors on the site directly affects this score.
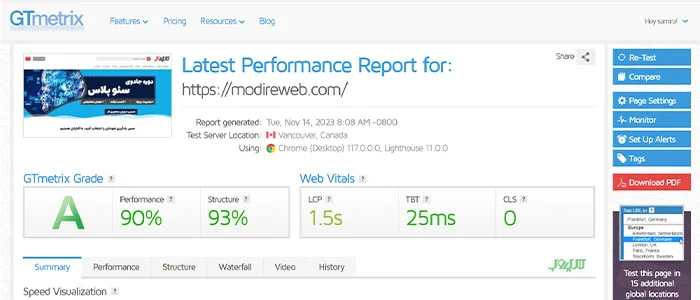
Web Vital section
In this section, you will be given three separate points.
LCP invoice
We got acquainted with this factor separately in the above sections. Its importance is so high for GTmetrix that it has a separate score for it. To get the green color and the highest score in this section, it is better to have a maximum LCP time of 1 second.
TBT factor
We also learned about the TBT factor above, which means the time the site is blocked. For optimal performance, this factor should be less than 150 milliseconds.
Cumulative Layout Shift
This factor also shows how much the site changes during loading. In order to get a good score in this section as well, you need to get it to about 0.1.
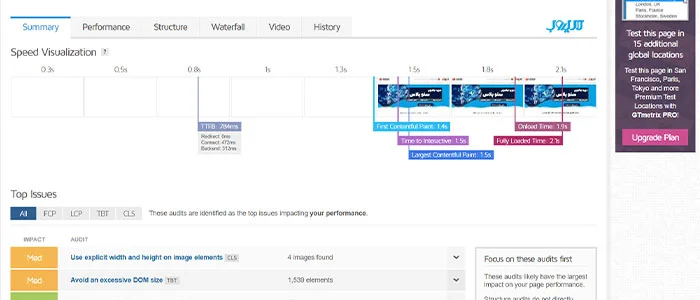
Other parts of GTmetrix
In the above section, we got acquainted with the different scoring parts of this tool. But this tool, apart from the mentioned ones, also has other sections that we will get to know for better use.
Waterfall
In this section, a comprehensive list of all the content that is consumed in loading a page and the loading time of each will be shown to you. This section shows you the loading order of the content and specifies which content has the most Load to load. By knowing these factors, you can optimize site speed and loading more easily. In fact, in this section, you can see exactly what is slowing down your site and go to it exactly.
Video
In this section, you will watch a video that shows the entire process of loading the site. In fact, you can visually see which element takes the most time to load.
History
In this section, a hierarchy of the changes made will be displayed to you. You can also see how fast the site was at any particular date and time. As a result, you can find out the slowest and fastest loading times of the site and see the reason for each.
Page Detail
In this section, you will find a lot of useful information:
Page Load Time shows the complete loading time of the site.
Total Page Size: This section shows you the main page size of the site.
Request. This part of GTmetrix shows the number of server requests to load different parts of the site. The lower the number of these requests between the browser and the server, the faster the site will be.
How to increase the score of your site in the GTmetrix tool?
After the analysis by this tool, you will get to know the existing issues and problems as much as possible, and the tool itself will provide you with solutions. Before using the tool and testing your speed, you can optimize your site speed by doing other things. In the following, we will get to know some of these solutions.
Appropriate size of images
The images used on the site should be considered as the most frequent high-volume content. Be sure to use images with the optimal size so that the loading of the site is not delayed. The heavier your images are, the more they affect FCP and LCP, and site speed. Currently, there are various tools that allow you to optimize the size of images without reducing the quality.
Use of CDN content distribution network
The content distribution network plays a very important role in scoring by this tool. This network conveys a uniform web browsing experience to users worldwide. To get a higher score in this network, you can increase the number of files cached on the CDN servers.
Combine images with a CSS script.
A site has different icons. These icons are downloaded separately, send their requests to the server separately, and are processed separately. This issue can slow down the site. To avoid this problem, you can combine the icons and raise them using a CSS Script. With this, the browser will check only one request, and the speed of the site will increase.

Problems using GTmetrix
After getting acquainted with the basics and functions, advantages, and different parts of GTmetrix, we want to know what problems the use of this tool will lead to.
- If you choose the test server in your country, the site may randomly change the server. Therefore, since users from different countries connect to the server, the final result may not be very accurate.
- Repeating an analysis in this tool according to factors such as server congestion and other things can give you different results and confuse you in the analysis. To avoid this problem, try to do your tests in similar conditions, for example, the same Internet network, the same system, and at the same time.
- This tool, like any other tool, is constantly being updated and changed. Some of your invoices may have changed, and you may not be aware of it. To avoid this problem, you should always try to keep yourself up to date and be aware of the changes.
Conclusion
One of the important factors for site optimization is its speed. You can use different tools to check the site speed and optimize it. GTmetrix is one of the best and most powerful of these tools. This tool has different sections and factors that check all the components and content of your site, analyze the speed in different sections, find existing problems, and help you optimize the site.
FAQ
What is GTmetrix?
A tool that analyzes website speed and performance, providing actionable insights.
What key metrics does it measure?
Metrics like FCP, LCP, Speed Index, and Total Blocking Time to identify performance issues.
How can I improve my GTmetrix score?
Optimize images, enable caching, minify CSS/JS/HTML, use CDNs, and defer non-essential scripts.