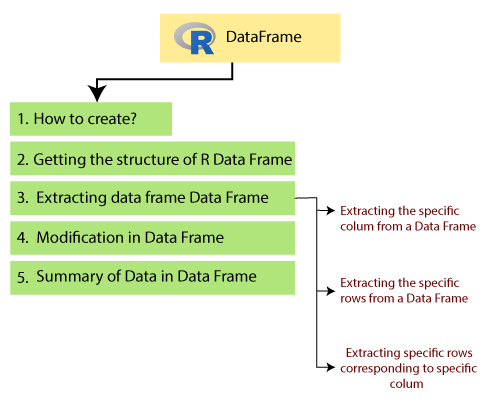
A Complete Guide to Working with Data Frames in R
Data Frames In R: A data frame is a table or array structure with two dimensions in which each column contains values of variables, and each row contains a set of values for each column.
In the following, the specifications of a data frame are given below:
- Column names should not be empty.
- Row names must be special.
- The stored data of the dataframe can be numerical, invoice, or character type.
- Each column must contain the same number of data items.
Create Data Frames
# Create the data frame.

emp.data <- data.frame (

emp_id = c (1: 5),

emp_name = c ("Rick", "Dan", "Michelle", "Ryan", "Gary"),

salary = c (623.3,515.2,611.0,729.0,843.25),

start_date = as.Date (c (“2012-01-01”, “2013-09-23”, “2014-11-15”, “2014-05-11”,

“2015-03-27”)),

stringsAsFactors = FALSE

)

# Print the data frame.

print (emp.data)
When we run the above code, we get the following result:
emp_id emp_name salary start_date

1 1 Rick 623.30 2012-01-01

2 2 Dan 515.20 2013-09-23

3 3 Michelle 611.00 2014-11-15

4 4 Ryan 729.00 2014-05-11

5 5 Gary 843.25 2015-03-27
Data Frames Structure
The data frame structure can be viewed using the str() function.
# Create the data frame.

emp.data <- data.frame (

emp_id = c (1: 5),

emp_name = c ("Rick", "Dan", "Michelle", "Ryan", "Gary"),

salary = c (623.3,515.2,611.0,729.0,843.25),

start_date = as.Date (c (“2012-01-01”, “2013-09-23”, “2014-11-15”, “2014-05-11”,

“2015-03-27”)),

stringsAsFactors = FALSE

)

# Get the structure of the data frame.

str (emp.data)
When we run the above code, we get the following result:
'data.frame': 5 obs. of 4 variables:
$ emp_id : int 1 2 3 4 5
$ emp_name: chr "Rick" "Dan" "Michelle" "Ryan" ...
$ salary : num 623 515 611 729 843
$ start_date: Date, format: "2012-01-01" "2013-09-23" "2014-11-15" "2014-05-11" ...
Summarize Data In The Data Frames
Statistical summary and the nature of the data can be obtained by applying the summary () function :
# Create the data frame.

emp.data <- data.frame (

emp_id = c (1: 5),

emp_name = c ("Rick", "Dan", "Michelle", "Ryan", "Gary"),

salary = c (623.3,515.2,611.0,729.0,843.25),

start_date = as.Date (c (“2012-01-01”, “2013-09-23”, “2014-11-15”, “2014-05-11”,

“2015-03-27”)),

stringsAsFactors = FALSE

)

# Print the summary.

print (summary (emp.data))
When we run the above code, the following result is obtained:
emp_id emp_name salary start_date

Min. : 1 Length: 5 Min. : 515.2 Min. : 2012-01-01

1st Qu.:2 Class: character 1st Qu.:611.0 1st Qu.:2013-09-23

Median: 3 Mode: character Median: 623.3 Median: 2014-05-11

Mean: 3 Mean: 664.4 Mean: 2014-01-14

3rd Qu.:4 3rd Qu.:729.0 3rd Qu.:2014-11-15

Max. : 5 Max. : 843.2 Max. : 2015-03-27
Extract Data From Data Frames
Extracting a specific column from the data frame can be done using the column name:
# Create the data frame.

emp.data <- data.frame (

emp_id = c (1: 5),

emp_name = c ("Rick", "Dan", "Michelle", "Ryan", "Gary"),

salary = c (623.3,515.2,611.0,729.0,843.25),

start_date = as.Date (c (“2012-01-01 ″,” 2013-09-23 ″, ”2014-11-15 ″,” 2014-05-11 ”,

“2015-03-27”)),

stringsAsFactors = FALSE

)

# Extract Specific columns.

result <- data.frame (emp.data $ emp_name, emp.data $ salary)

print (result)
When you run the above code, you get the following result:
emp.data.emp_name emp.data.salary

1 Rick 623.30

2 Dan 515.20

3 Michelle 611.00

4 Ryan 729.00

5 Gary 843.25
Extract the first two rows and then all the columns
# Create the data frame.

emp.data <- data.frame (

emp_id = c (1: 5),

emp_name = c ("Rick", "Dan", "Michelle", "Ryan", "Gary"),

salary = c (623.3,515.2,611.0,729.0,843.25),

start_date = as.Date (c (“2012-01-01”, “2013-09-23”, “2014-11-15”, “2014-05-11”,

“2015-03-27”)),

stringsAsFactors = FALSE

)

# Extract first two rows.

result <- emp.data [1: 2,]

print (result)
By executing the above code, the following results are obtained:
emp_id emp_name salary start_date

1 1 Rick 623.3 2012-01-01

2 2 Dan 515.2 2013-09-23
Extract the third and fifth rows with the second and fourth columns.
# Create the data frame.

emp.data <- data.frame (

emp_id = c (1: 5),

emp_name = c ("Rick", "Dan", "Michelle", "Ryan", "Gary"),

salary = c (623.3,515.2,611.0,729.0,843.25),

start_date = as.Date (c (“2012-01-01”, “2013-09-23”, “2014-11-15”, “2014-05-11”,

“2015-03-27”)),

stringsAsFactors = FALSE

)

# Extract 3rd and 5th row with 2nd and 4th column.

result <- emp.data [c (3,5), c (2,4)]

print (result)
Executing the above code produces the following result in the output:
emp_name start_date

3 Michelle 2014-11-15

5 Gary 2015-03-27
Expand the Data Frames.
A data frame can be expanded by adding rows and columns.
Add a column
A column vector using the name of a new column; we add:
# Create the data frame.
emp.data <- data.frame (
emp_id = c (1: 5),
emp_name = c ("Rick", "Dan", "Michelle", "Ryan", "Gary"),
salary = c (623.3,515.2,611.0,729.0,843.25),
start_date = as.Date (c (“2012-01-01”, “2013-09-23”, “2014-11-15”, “2014-05-11”,
“2015-03-27”)),
stringsAsFactors = FALSE
)
# Add the “dept” coulmn.
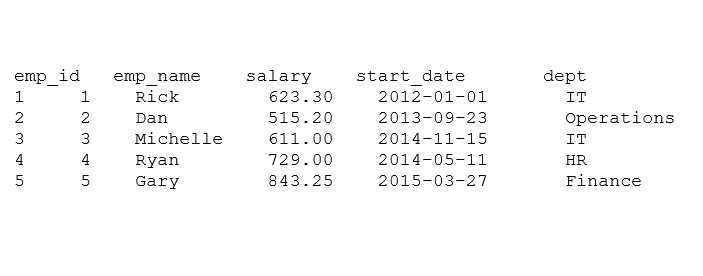
emp.data $ dept <- c ("IT", "Operations", "IT", "HR", "Finance")
v <- emp.data
print (v)When we run the above code, the following result is obtained:
emp_id emp_name salary start_date dept

1 1 Rick 623.30 2012-01-01 IT

2 2 Dan 515.20 2013-09-23 Operations

3 3 Michelle 611.00 2014-11-15 IT

4 4 Ryan 729.00 2014-05-11 HR

5 5 Gary 843.25 2015-03-27 Finance
Add a Row
To add more rows to an existing data frame, we must enter new rows in the same existing data structure and use the rbind () function.
In the following example, we create a new data frame with additional rows and merge it with the existing data frame to produce the final data frame.
# Create the first data frame.

emp.data <- data.frame (

emp_id = c (1: 5),

emp_name = c ("Rick", "Dan", "Michelle", "Ryan", "Gary"),

salary = c (623.3,515.2,611.0,729.0,843.25),

start_date = as.Date (c (“2012-01-01”, “2013-09-23”, “2014-11-15”, “2014-05-11”,

“2015-03-27”)),

dept = c ("IT", "Operations", "IT", "HR", "Finance"),

stringsAsFactors = FALSE

)

# Create the second data frame

emp.newdata <- data.frame (

emp_id = c (6: 8),

emp_name = c ("Rasmi", "Pranab", "Tusar"),

salary = c (578.0,722.5,632.8),

start_date = as.Date (c (“2013-05-21 ″,” 2013-07-30 ″, ”2014-06-17”)),

dept = c (“IT”, “Operations”, “Fianance”),

stringsAsFactors = FALSE

)

# Bind the two data frames.

emp.finaldata <- rbind (emp.data, emp.newdata)

print (emp.finaldata)
When the above code is executed, the following result is created:
emp_id emp_name salary start_date dept

1 1 Rick 623.30 2012-01-01 IT

2 2 Dan 515.20 2013-09-23 Operations

3 3 Michelle 611.00 2014-11-15 IT

4 4 Ryan 729.00 2014-05-11 HR

5 5 Gary 843.25 2015-03-27 Finance

6 6 Rasmi 578.00 2013-05-21 IT

7 7 Pranab 722.50 2013-07-30 Operations

8 8 Tusar 632.80 2014-06-17 Fianance
FAQ
How do I create a data frame in R?
Use data.frame() with equal-length vectors, e.g., df <- data.frame(Name=c("A","B"), Age=c(30,25)).
How can I access a column or row in a data frame?
Use df$ColumnName, or df[ , "ColumnName"], or df[1, ] for rows.
What operations can I do on data frames?
You can add/remove columns or rows (cbind, rbind), get summary stats (summary()), check size (nrow(), ncol()), and merge tables.