How to Draw a Diagram of a Network
Drawing Network Diagrams Helps You Get A Clear View Of All Devices And Their Connections. There Are Good Free Programs For This Purpose.
This article will use the site www.Draw.io to build our network chart. Follow the steps below to draw a diagram.
Draw a diagram of a network
1. Go to www.draw.io.com in your browser. If you click Change Storage on the first page, you will select the location where the chart will be stored.

If you have a Google Drive or OneDrive account, you can easily save your chart on these cloud servers.
If you do not have an account with these services, select the Device option to save the chart to your computer’s hard drive when you are done.
2. Select the Create New Diagram option.

Select a name for the chart, then click the Create button on the page that appears.
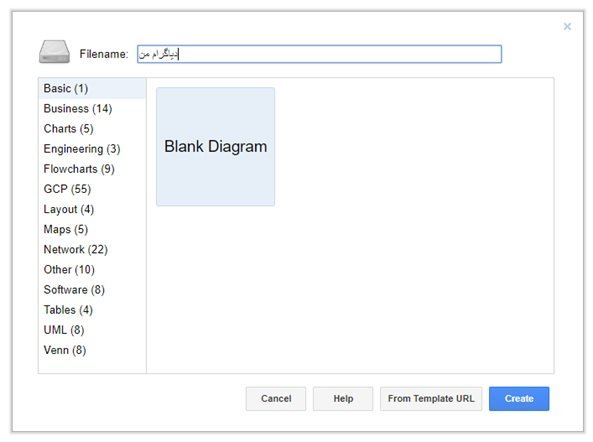
You should now see the following page.
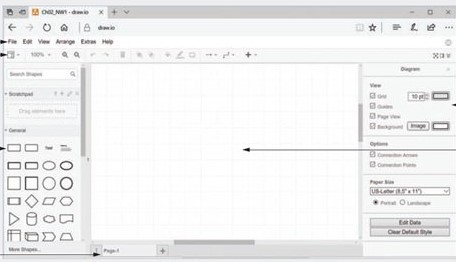
3. To add shapes to the canvas, you can select a profile and place it on the canvas or use the drag-and-drop technique. When you place a body on the canvas, the right panel changes to show options for editing the profile.
4. When placing a shape on the canvas, select the desired shape and start typing to add tags. After ordering the label, clicking the tab in the right panel lets you edit colors, fonts, background colors, and more.
To make a connection, select the shape and use the four arrows around the profiles to connect them. By combining the shapes, blue dots appear on the connecting line.
5. Select Ctrl + A and press the Delete key to remove shapes from the canvas.
6. There is a More Shapes option at the bottom left of the screen. Clicking this option will open a window. In the Networking section, the window that appears offers options for accessing Cisco forms.
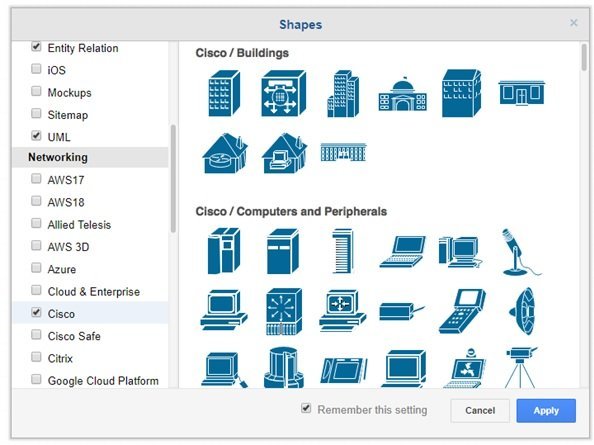
7. You can access Cisco icons when clicking on the Cisco option.

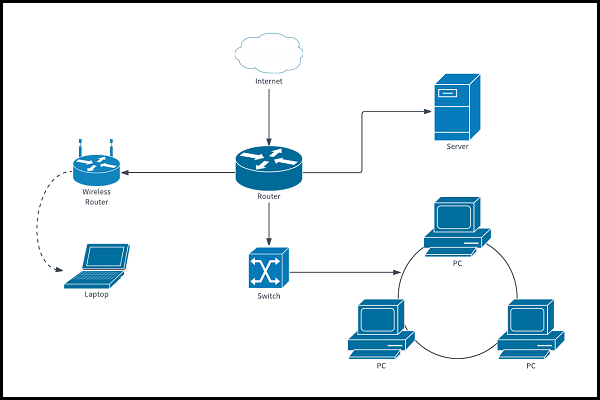
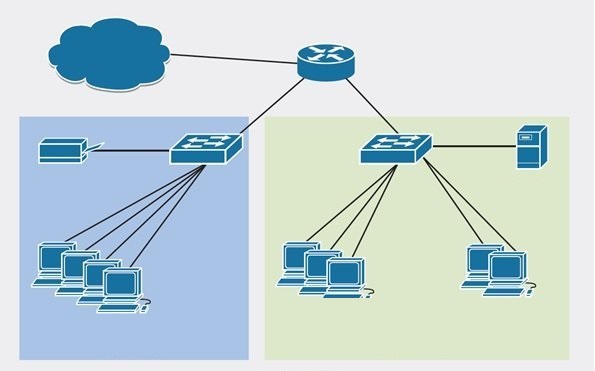
8. Draw the following diagram using the symbols available to you. The image’s black lines represent the devices’ logical connections, and the cloud represents the Internet. The colored boxes in this image also show different subnets.
9. When done, the chart will be held in XML file format if you click save. To keep the file in image format, click Export and select PNG.
Most network diagrams provide a broad picture of the network’s physical or logical topology. Charts help you add new switches, special routers, gateways, and firewalls.
If you are a technician looking to find a fault with a wired connection on a local network, checking the network diagram can be very helpful.
In such a case, you should see a network wiring diagram that provides a graphical view of the wired connections. Carefully identifying the exact connection problem with the wires connecting the various devices and the location of the cables should not be difficult. Note that some network schemas may not provide as much detail about connections.
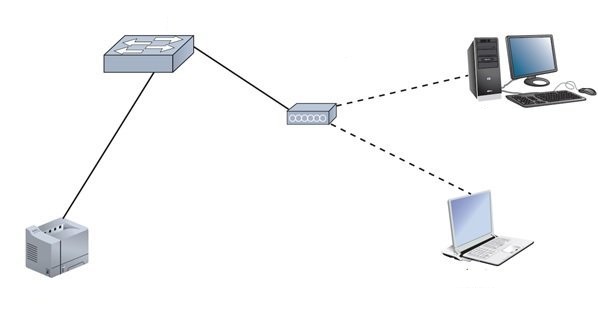
The following figure shows an example of a wired schema belonging to a small office network that uses a broadband cable to access the Internet.
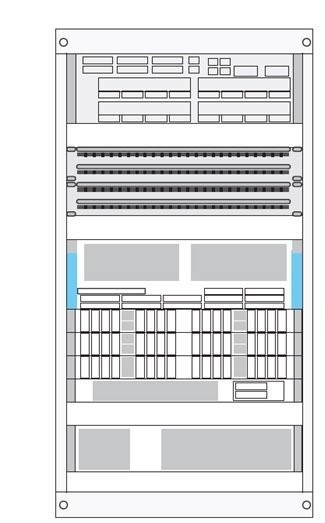
Graphs are not limited to drawing tangible and objective equipment. Graphs can show the location of devices inside frames and any row of shelves. You can use the diagrams to remove the rack and its internal gear.
Drawing diagrams helps install a rack inside a building. These diagrams are also helpful for tracking and debugging equipment installed inside the frame. The Draw.io site provides the symbols needed to draw the rack and its internal gear. The following figure shows an example of a diagram for a simple frame.
Network charts provide a visual view of a network. However, charts may not cover all the information contained in the documentation.
Network diagrams
A knowledge base is a set of solutions and insights you have gained and documented during the implementation of a network or problem-solving. Another reliable form of writing network events is charted. The diagrams show how devices and connections communicate.
These diagrams may include physical layout, logical topology, reserved IP addresses, names of significant network devices, and types of transmission media.
The following figure shows a simple network diagram illustrating the physical topology of a network.
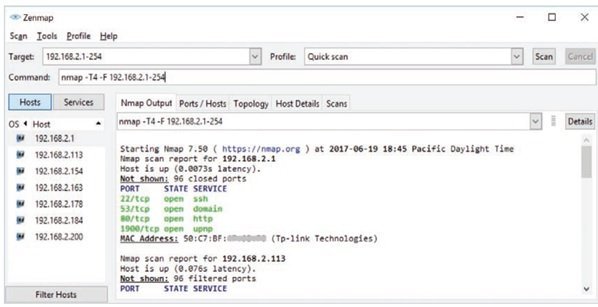
A diagram simplifies troubleshooting and locating network devices. Technicians can use several programs to detect, place, and monitor active network devices. One of the simplest and most popular tools is Nmap. The following figure shows the Nmap tool.
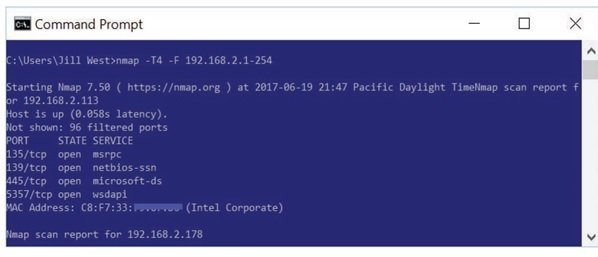
Nmap is a Linux-based command-line tool developed and made available to other operating system experts.
The illustrated version of this tool is Zenmao, which is used to detect devices on a network.
Network mapping is a fascinating topic that helps you minimize the complexity of today’s networks. Every network technician can understand the general concepts from a network map. You can draw diagrams or maps of network equipment on paper or use graphic software.
Most people prefer specialized software for drawing network diagrams. Edraw, SmartDraw, Microsoft Visio, and Network Notepad are popular graphic software in this field. These programs provide icons for the connected devices.
Cisco has long advocated the use of digital symbols for switches, routers, firewalls, and other devices. Today, these symbols are widely used in networking. The following figure shows a simple network diagram using standard icons that comply with Cisco guidelines.
In the figure below, each device is labeled.

- Like a hockey ball with arrows coming and going, the shape symbolizes a router.
- A switch is shown with a small rectangular box surrounded by four arrows in different directions.
- A wireless access point is also a rectangular box with spiral lines.
- A brick wall represents a wall of fire.
- The Internet or unspecified parts of the network are also marked with a cloud symbol.
Cisco has developed hundreds of symbols for network equipment so that technicians can easily draw a network diagram. In the table below, you will get acquainted with the most common symbols you will deal with during these tutorials. Visit www.network-topology.com to download Cisco’s icons and prepare detailed reports, presentations, documents, and charts.
FAQ
What basic symbols are used in network diagrams?
Typical symbols represent routers, switches, firewalls, servers, workstations, and connection lines to show relationships.
Why should you draw a network diagram before planning or troubleshooting?
Because it helps you understand device locations, connections, and data flow — making network planning and troubleshooting easier.
What tools can help you draw network diagrams effectively?
Use diagramming tools or software that offer network icons and templates to ensure clarity and standard notation.