
Get Familiar with Google Analytics 4
If you are looking for a way to get more reports about the performance of the site and its content and thus make better decisions in marketing your products and services, Google Analytics 4 is certainly a powerful and appropriate tool for you.
Google Analytics 4 is the latest version of Google Analytics, which most businesses use to track user interaction and traffic on their site. This version of Google Analytics provides more detailed reports on how users interact. And the way these reports are displayed is also different compared to the previous versions. Among the new features of Google Analytics 4, we can mention new and attractive data structures, providing AI-based reports and predictions, displaying more details about the user’s activity cycle, etc.
Familiarizing yourself with the features and facilities of Google Analytics 4 will help you analyze your website’s performance more intelligently and draw more accurate conclusions. Surely, by reading this article, all your questions and doubts about this platform will be cleared. A deeper examination of this analytical tool’s details and new features will make you realize its importance. So let’s start the Google Analytics 4 review:
What is Google Analytics 4?

In October 2020, Google introduced a new version of Google Analytics. But the tool that has been used to analyze the performance of site users, because of what updates and changes, has been named Google Analytics 4.
Millions of businesses and websites use Google Analytics tools to track user interactions with web domains, mobile apps, and offline APIs.
Most businesses know this platform as a tool to get site traffic and monitor site content. But by presenting Google Analytics 4, Google provided new and very different facilities to businesses, and these features distinguished this version from the universal understanding of Google Analytics.
Features of Google Analytics 4
In this section, we examine the features that have made this excellent tool so famous:
1. Privacy first
Google cares more about user privacy than ever and has implemented the same feature in its new analytics tool.
It is the user who decides whether or not the data related to his activity inside the website will be used for analysis during his presence on the website. Of course, this also creates some problems and gaps. Still, Google Analytics 4, using the power of machine learning, can eliminate these gaps and use the collected and available data to make predictions.
2. Cross-channel
The new version of Google Analytics combines reports from different platforms. In this way, this tool provides information related to all traceable channels, such as organic search, referrals, social networks, e-mail newsletters, advertisements, etc., using the cross-channel feature.
3. Prediction with AI
This feature was previously available for the paid version of Google Analytics, but with Google Analytics 4, it is available for all businesses.
In this way, machine learning algorithms can be used to predict user behavior, and this helps better to manage budgets, campaign periods, and target audiences.
Planning based on predictions will help you make a more brilliant next move and decide which areas to focus on. Getting the best returns with smart investment is the magic of Google Analytics 4.
4. Data flow collection
Data Streams are designed to integrate the features of websites, programs, etc. This data type is a tool to view cross-domain traffic remotely. By benefiting from this feature, the tracking of potential users on all platforms is done more comprehensively and powerfully.
5. More powerful conversion reports
Note: conversion is when the user reaches his desired goal on the website or application and becomes a customer.
In Google Analytics 4, Google has aimed to provide accurate and customer-oriented reports in conversions. In fact, by using the features of this tool, you can see the user’s visit to the website or the level of interaction on the way to purchase.
Examining and analyzing the stages that lead to conversion helps business owners implement practical solutions and become more capable in this field.
6. Focus more on events
Google Analytics 4 does most of the analysis based on events. Event-based reports are tagged with the special “EVENT” tag, making tracking specific metrics for ad serving easier.
In fact, discovering trending event reports allows businesses to use their content more intelligently to gain more conversions and trust.
7. More activity
The ability to connect Google Analytics 4 to Google Ads encourages business owners to use the collected data and process them.
By doing this, they can target the audience better by implementing new approaches.
Comparison of Google Analytics 4 and Universal Analytics

Although these two platforms are similar, they also have many differences. If you’ve used Universal Analytics before, you’ll notice the design and functionality changes very quickly. In this section, we examine some of the main differences between these two tools:
Google Analytics 4 does not have a bounce rate.
Google team has used engaged sessions instead of bounce rate in this version. So, instead of seeing people who leave your site without further interaction, it shows data about people who have engaged more with your site’s content. So, the engagement rate is the new and alternative metric in Google Analytics 4.
Google Analytics 4 uses events instead of goals.
In this tool, events are considered. Using the event-based model brings many benefits to businesses, the most important of which is cross-channel analysis. The use of this model has made Google Analytics 4 a more flexible tool and can predict user behavior well.
In Google Analytics 4, the monthly limit of visits has been removed.
Another important difference between Universal Analytics and Google Analytics 4 is the removal of monthly visit limits. The free version of Universal Analytics was limited to 10 million monthly visits, which some users had problems with.
Instead, the new version of Google Analytics has removed this limitation, and that’s why many users prefer to use this tool to analyze data related to their website.
With Google Analytics 4, connecting to BigQuery for free is possible.
If you are not familiar with BigQuery, it is better to define it like this:
“BigQuery makes it possible to search extensive and complex data sets faster.”
Google Analytics 4 allows users to connect to BigQuery for free and perform better and more accessible data analysis and sampling.
Checking all Google Analytics features 4

Google Analytics 4 is a complete and attractive symbol of data visualization. So that the graphs related to each data group provide a very clear result to the user. In this section, we examine all the features of this tool in full detail:
Report Snapshots
When you log into your account for the first time, this page will be displayed to you in the first part of the Reports section:
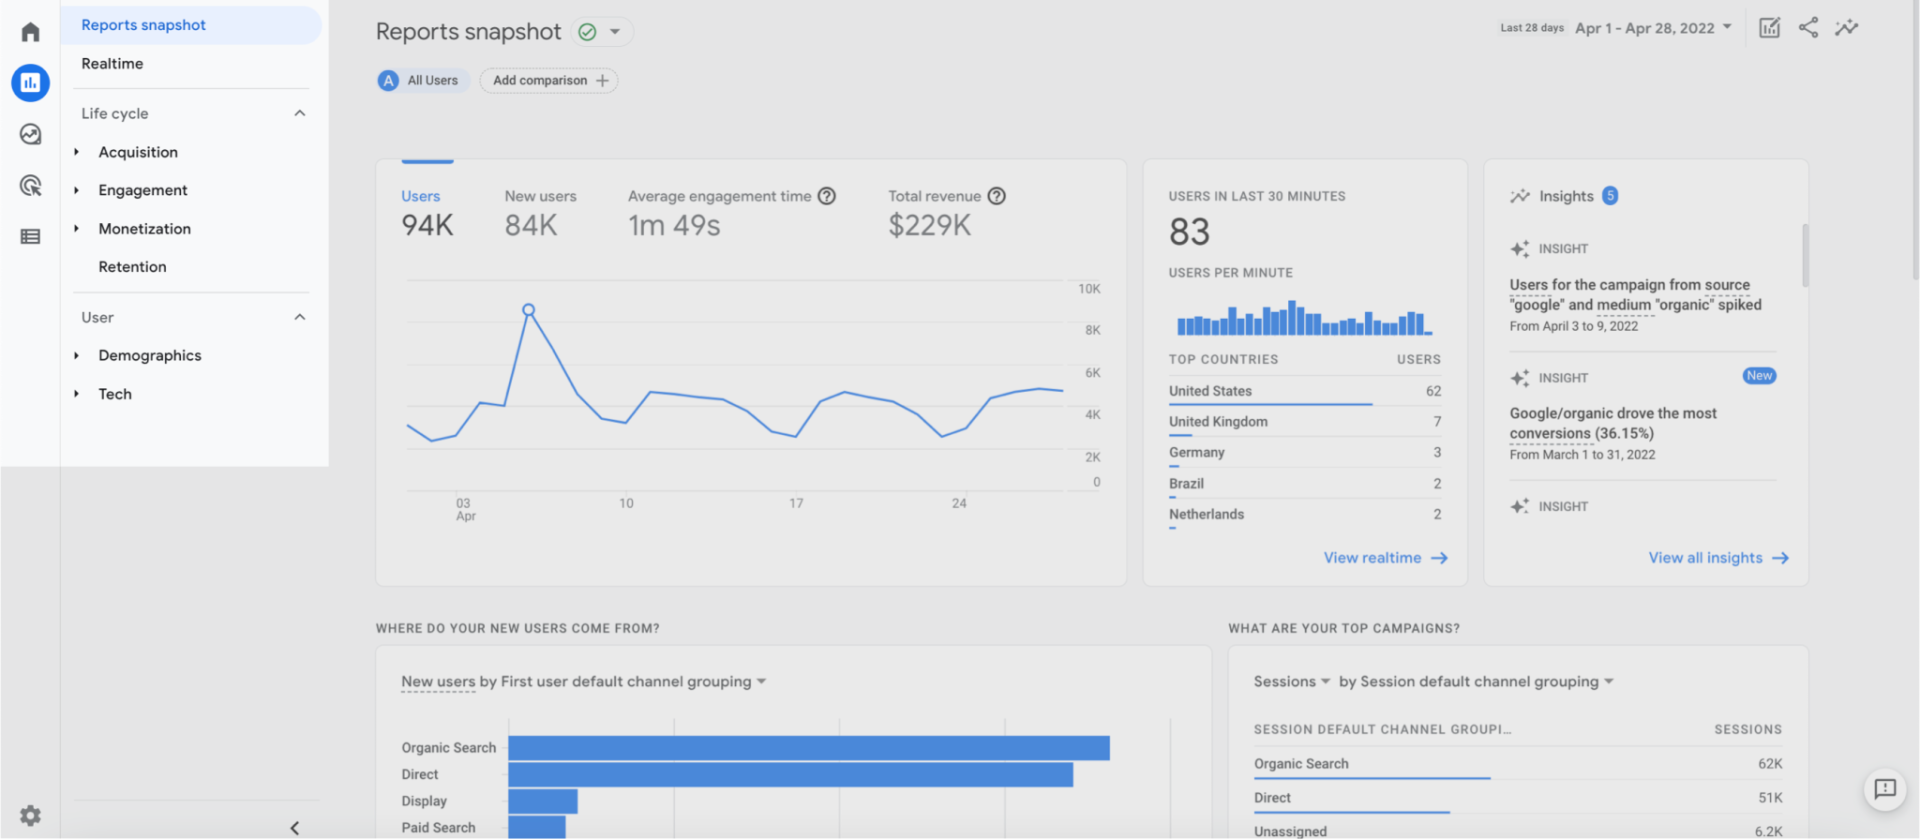
This section includes the site’s overall traffic, the number of new users, the average interaction time of each user and the number of assets in the specified time period. Note that if you have editing permission, you can also change the dimensions and criteria of the chart related to the reports.
Some of the questions you will find answers to with the charts presented in this section:
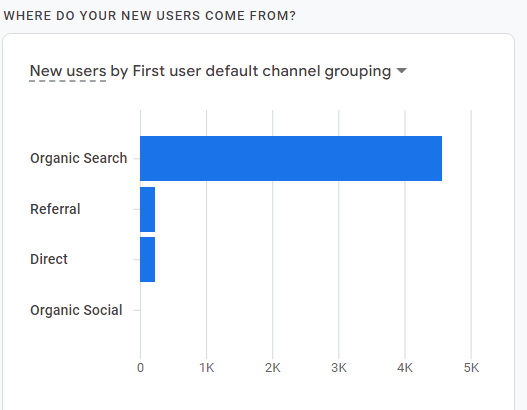
Where are your new users coming from?
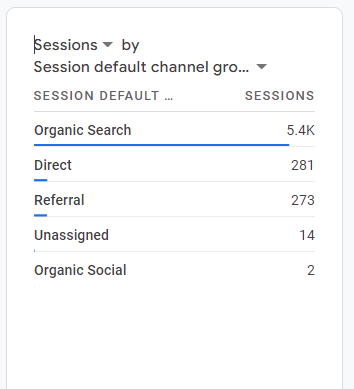
What are your best campaigns?
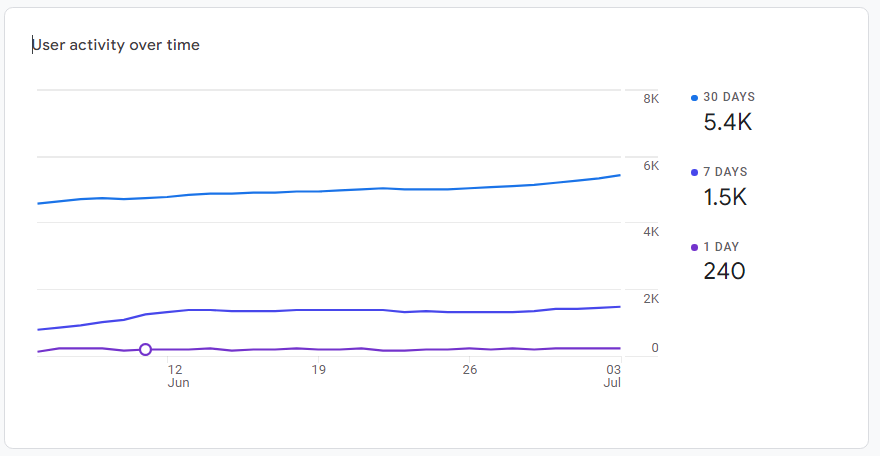
How has the performance of your active users been during the last day, week and month?
How has your performance been in retaining users?
Also, reports on articles with the most views, top events and best-selling products can also be seen in this section.
Realtime
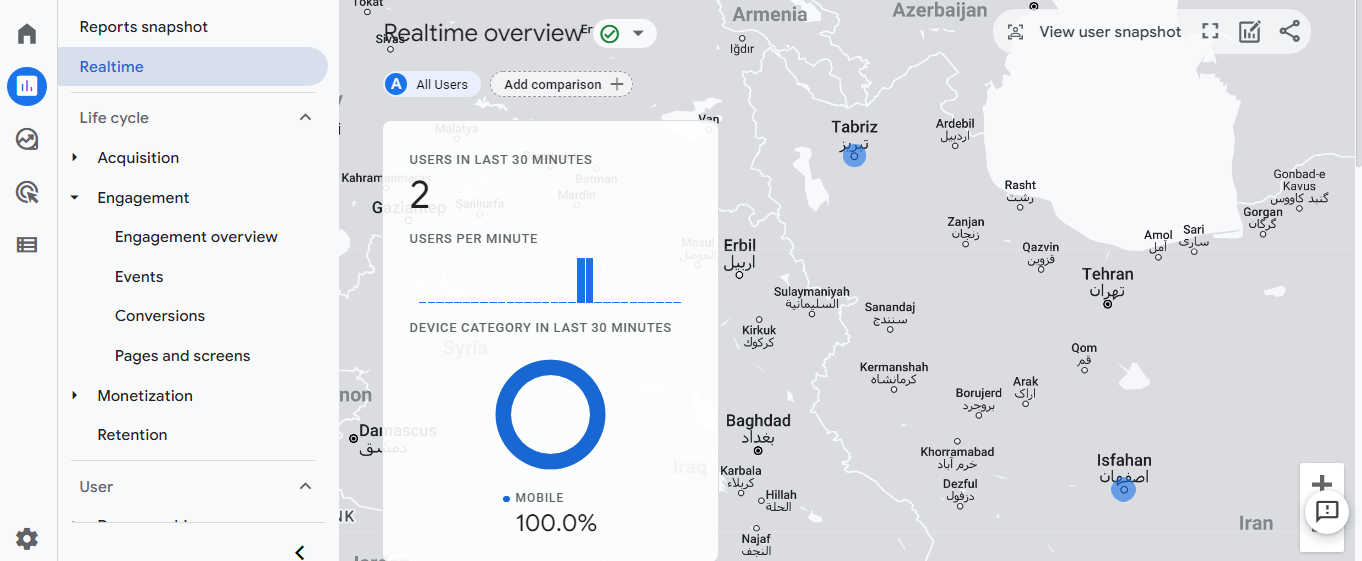
Real-time reports for the last 30 minutes are shown in this section.
This section is very effective for the following reasons:
- Direct review of the impact of one-day campaigns
- Making changes to the site with the overall goals in mind
- Separation of periods during the day and night based on the number of visits
lifecycle
In this section, Google Analytics 4 provides more detailed reports on user activity and helps you analyze data based on the stage of the customer journey where customers are:
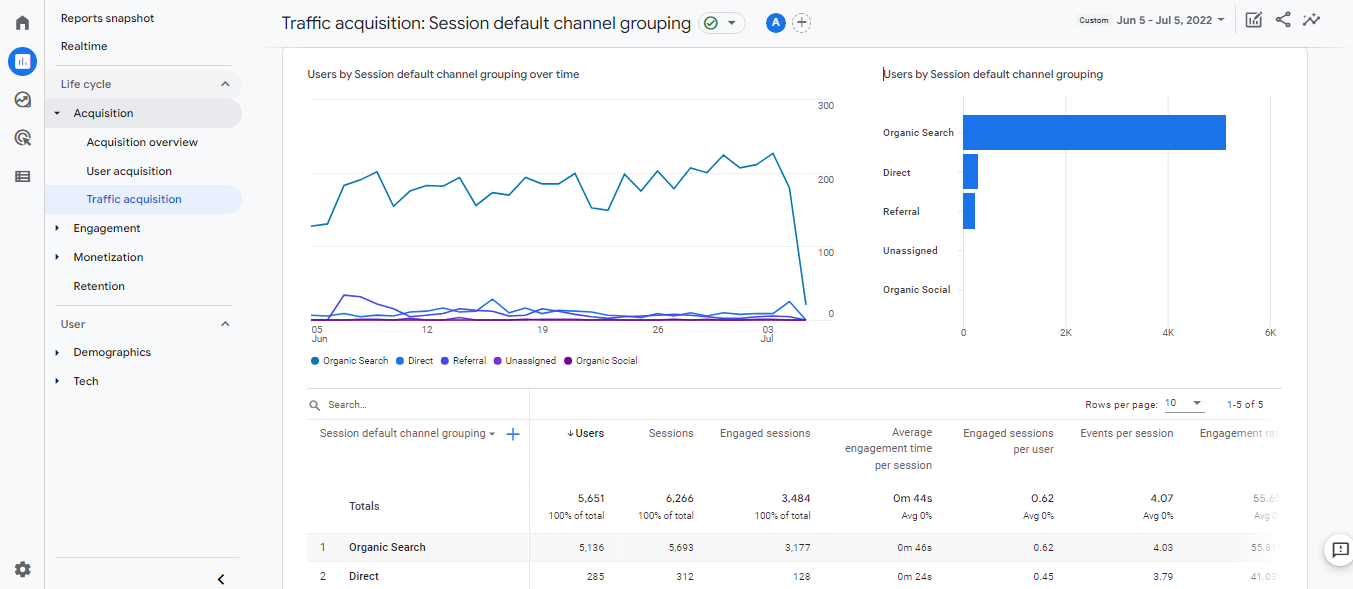
The acquisition is the first member of this collection that focuses on new and active users and their acquisition method (eg media, campaign, etc.).
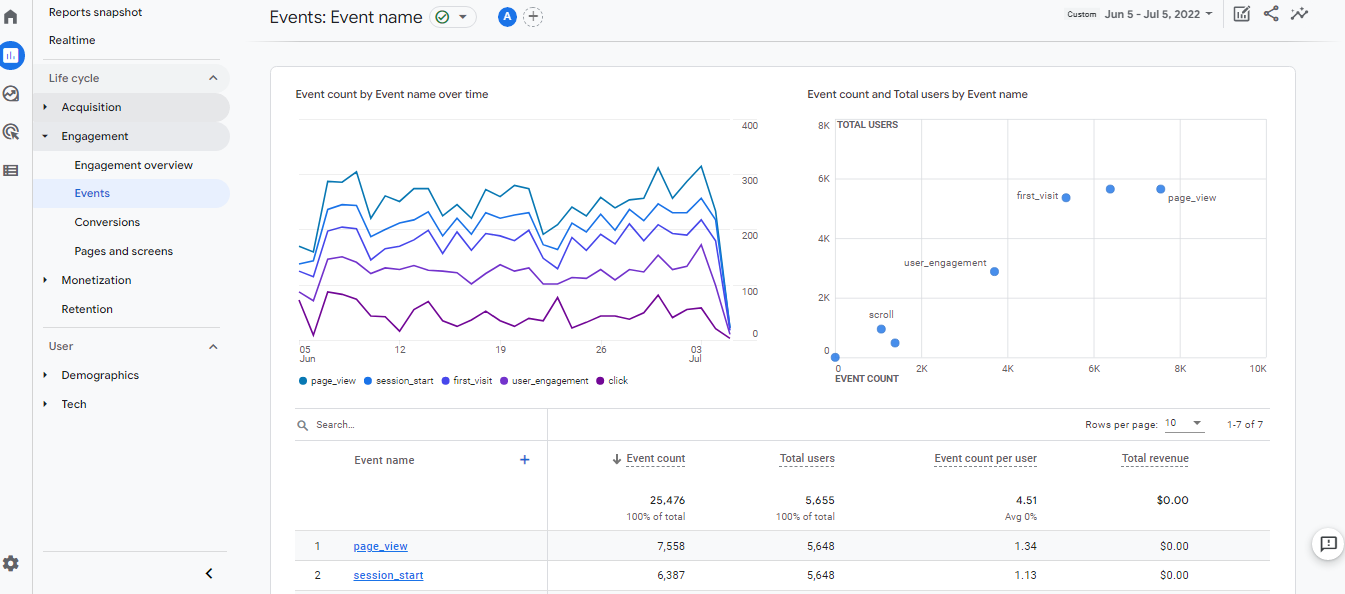
Engagement shows user activity based on the number of events, duration of engagement on the site or application, number of pages and articles visited, and number of times returning to the site or application.
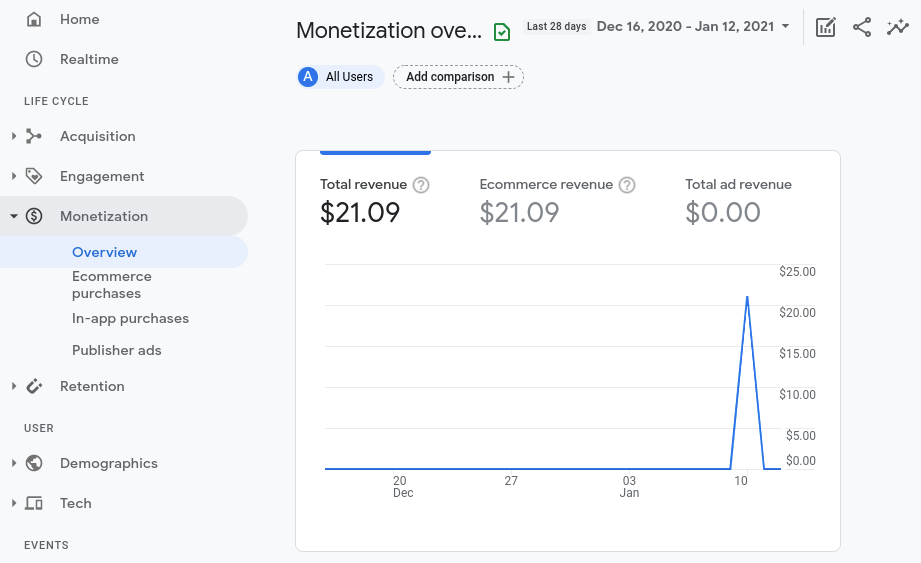
Monetization helps you track revenue from e-purchases, in-app purchases, subscriptions, and ads. Of course, note that each section consists of sub-sections you can check according to your wishes.
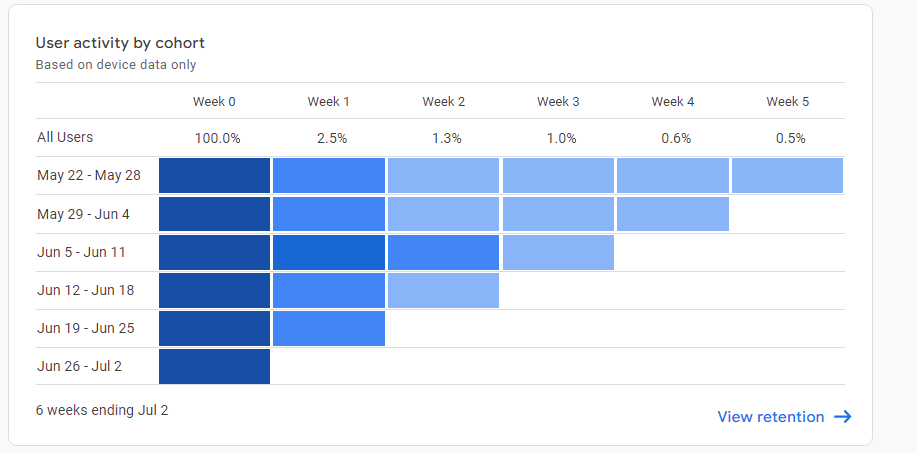
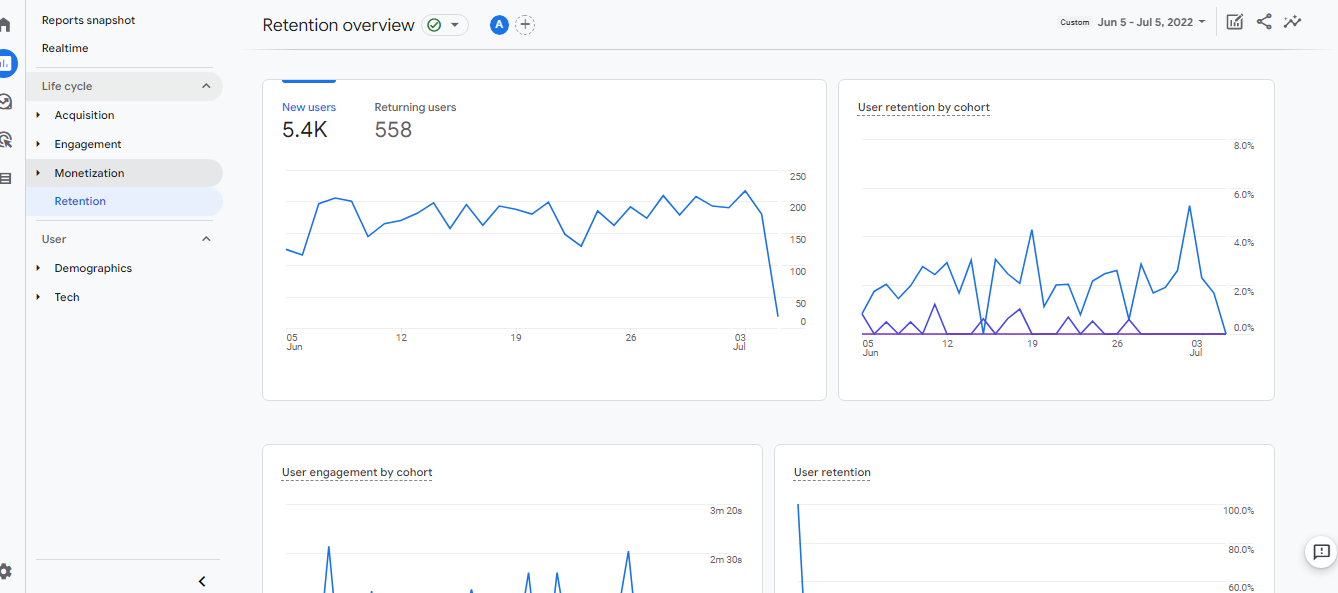
Retention covers how effective you are at converting new users into potential users and the percentage of users who return to your site or app.
User
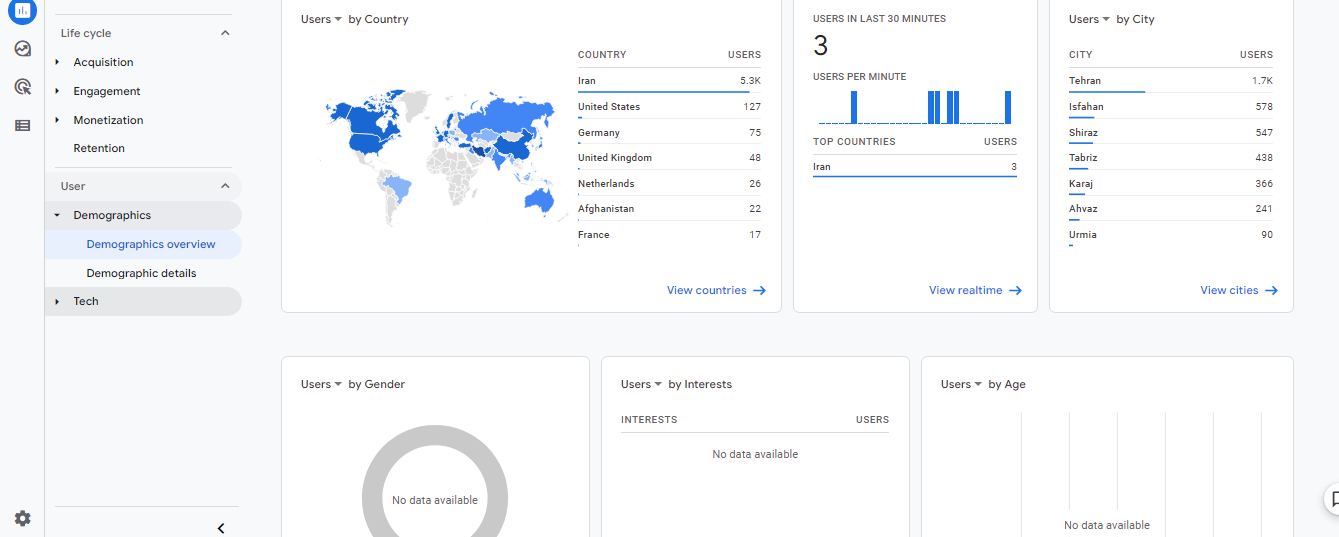
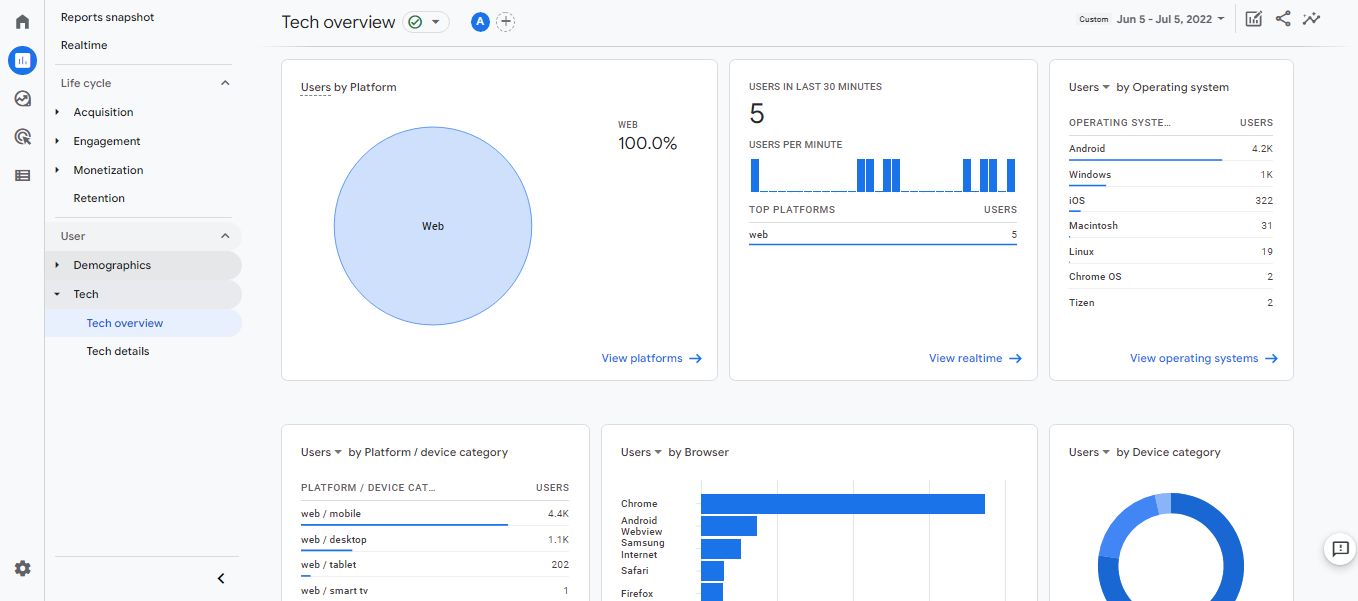
This section consists of two subcategories, Demographics, and Tech.
The Demographics section separated the analytical charts based on user characteristics (country, city, gender, age, interests, etc.).
The Tech department has also analyzed users’ access to the site and program based on device characteristics such as platform, operating system, browser, device model, screen resolution, etc.
Explore
The Exploration section offers a set of advanced techniques with which you can obtain more in-depth reports on the behavior of your customers and potential users with more detailed analysis:
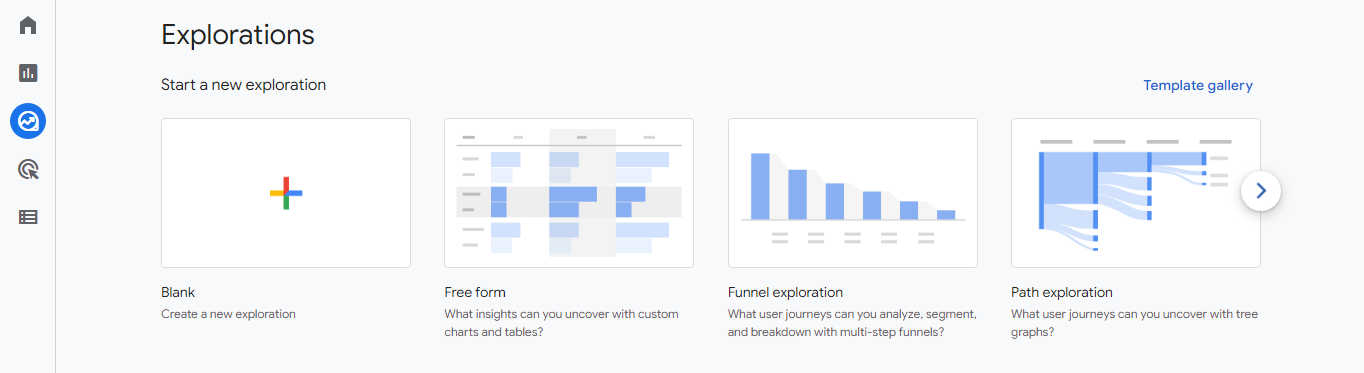
In general, there are several techniques for data exploration, of which Free Form, Cohort Analysis, Funnel Exploration, and Path Exploration are among the most widely used:
Funnel Exploration
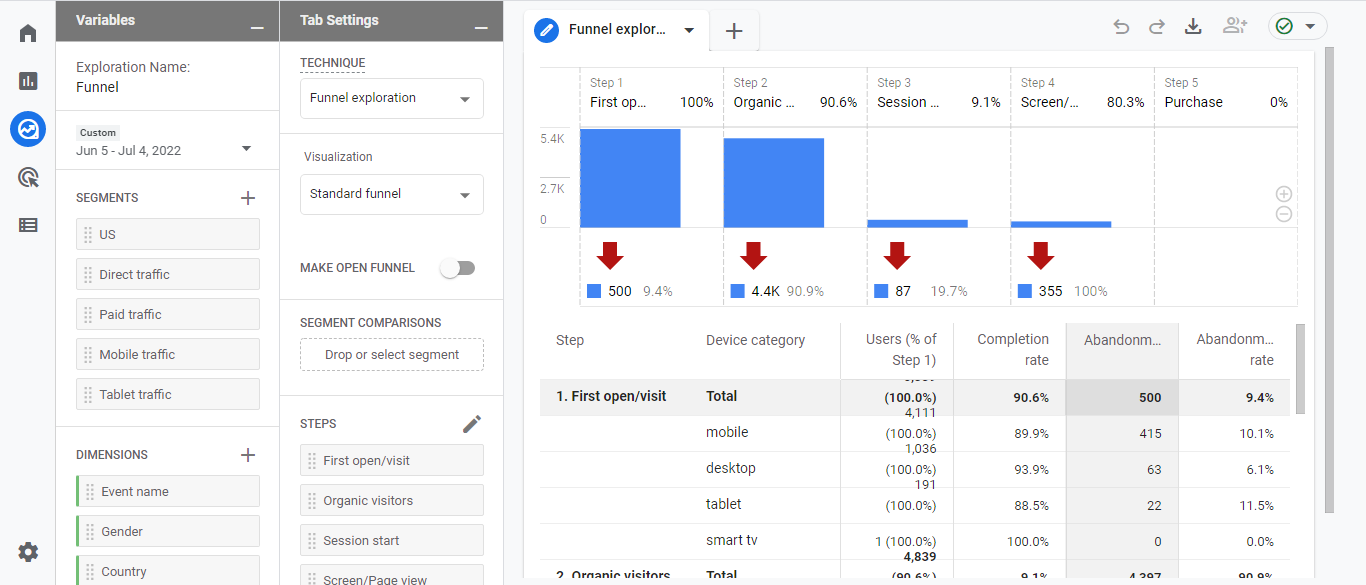
Using this technique, you can easily display various user activities, such as registration, purchase, etc., on the site or program using charts.
Path Exploration
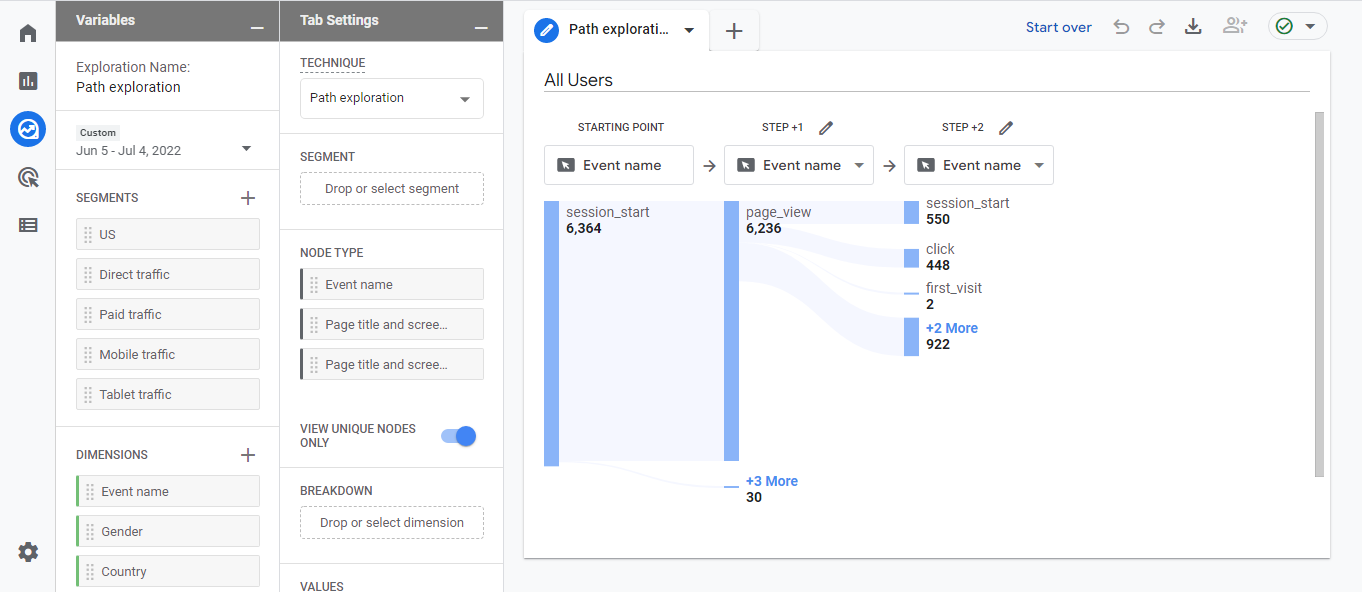
Viewing the path of users in your application or site using this technique will help you learn more about your strengths and weaknesses.
To use these techniques, just picture the pattern you have in mind. All the criteria, features, and dimensions you need are available in the left bar of each method.
Review the sections on the left toolbar of the Analytical Techniques section of the Exploration.
Variables: The variable column is where you select your desired data. SEGMENTS, DIMENSIONS, and METRICS time intervals are the features of this column that must be specified.
Tab Settings: The Tab Settings column is where you specify the analysis technique, add dimensions and criteria, and apply segmentation.
Segments: Segments are different groups of users. To use this section, just drag and drop the desired groups to compare their behavior.
Dimensions: Dimensions are the things you want to analyze, such as the number of events, active users, transactions, etc. To use this section, drag and drop the desired dimensions as rows or columns.
Metrics: Metrics provide numbers related to your analytics. In this way, you must add the criteria to the Values section in the Settings tab.
Visualization: The display method or the same type of graph is specified in this section. Table, pie chart, line chart, etc., are types of illustration charts that you can choose the most appropriate option according to your pattern and purpose.
Values: The desired criteria are added to this section as report columns. The cell type can be displayed as a bar chart, plain text or heatmap.
Tabs: Tabs show your charts. An analysis can have a maximum of 10 charges. To add a new tab, just click on the + icon.
Display: You can interact with the data by clicking on different parts of the charts.
Advertising snapshot
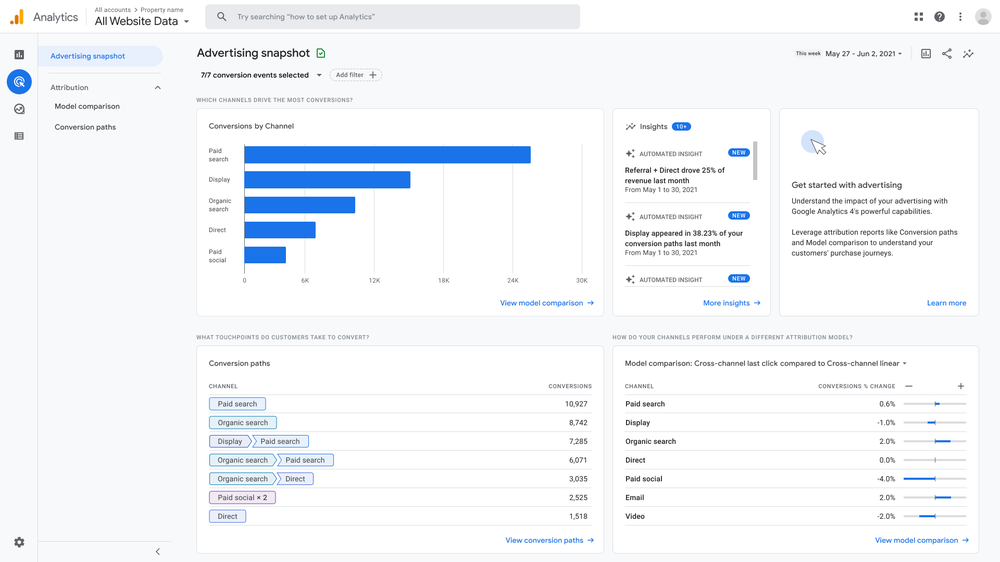
Conversions By Default Channel Grouping – Information about the channels with the most modifications in the default channel grouping.
Model Comparison – By referring to this section, you can see how different models cause changes in conversion rates.
Conversion Paths – This section provides information about the top conversion paths and the number of conversions in a given period.
Configure
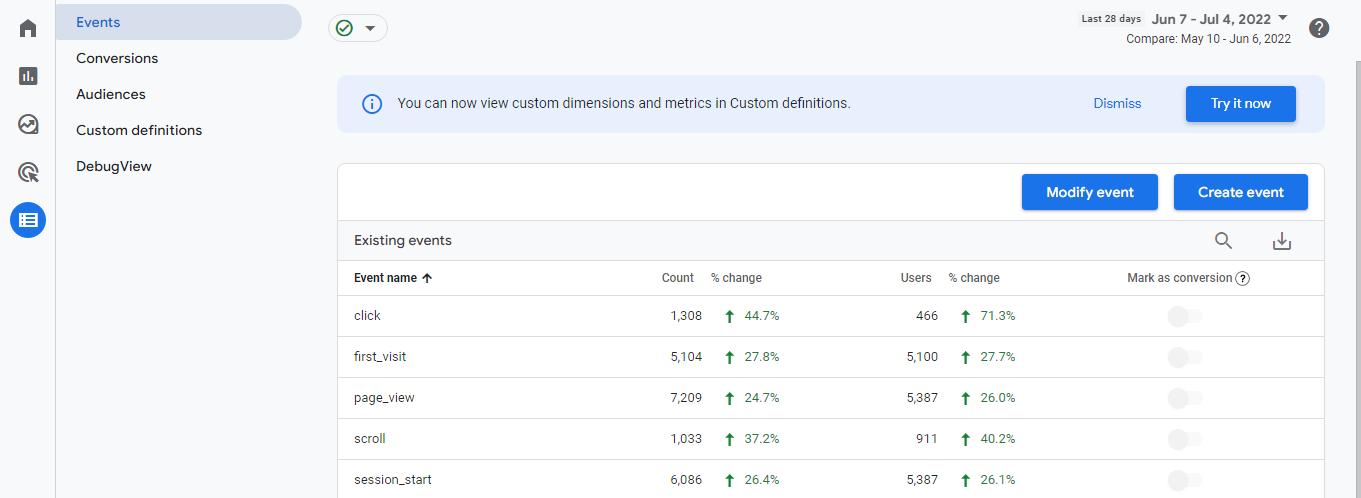
This section provides information about the number of events, audiences, conversions, and conversion rates of each. Also, DebugView to check the received data at a more detailed level and Custom Dimensions to use more data in the analyzes are placed in the Configure section.
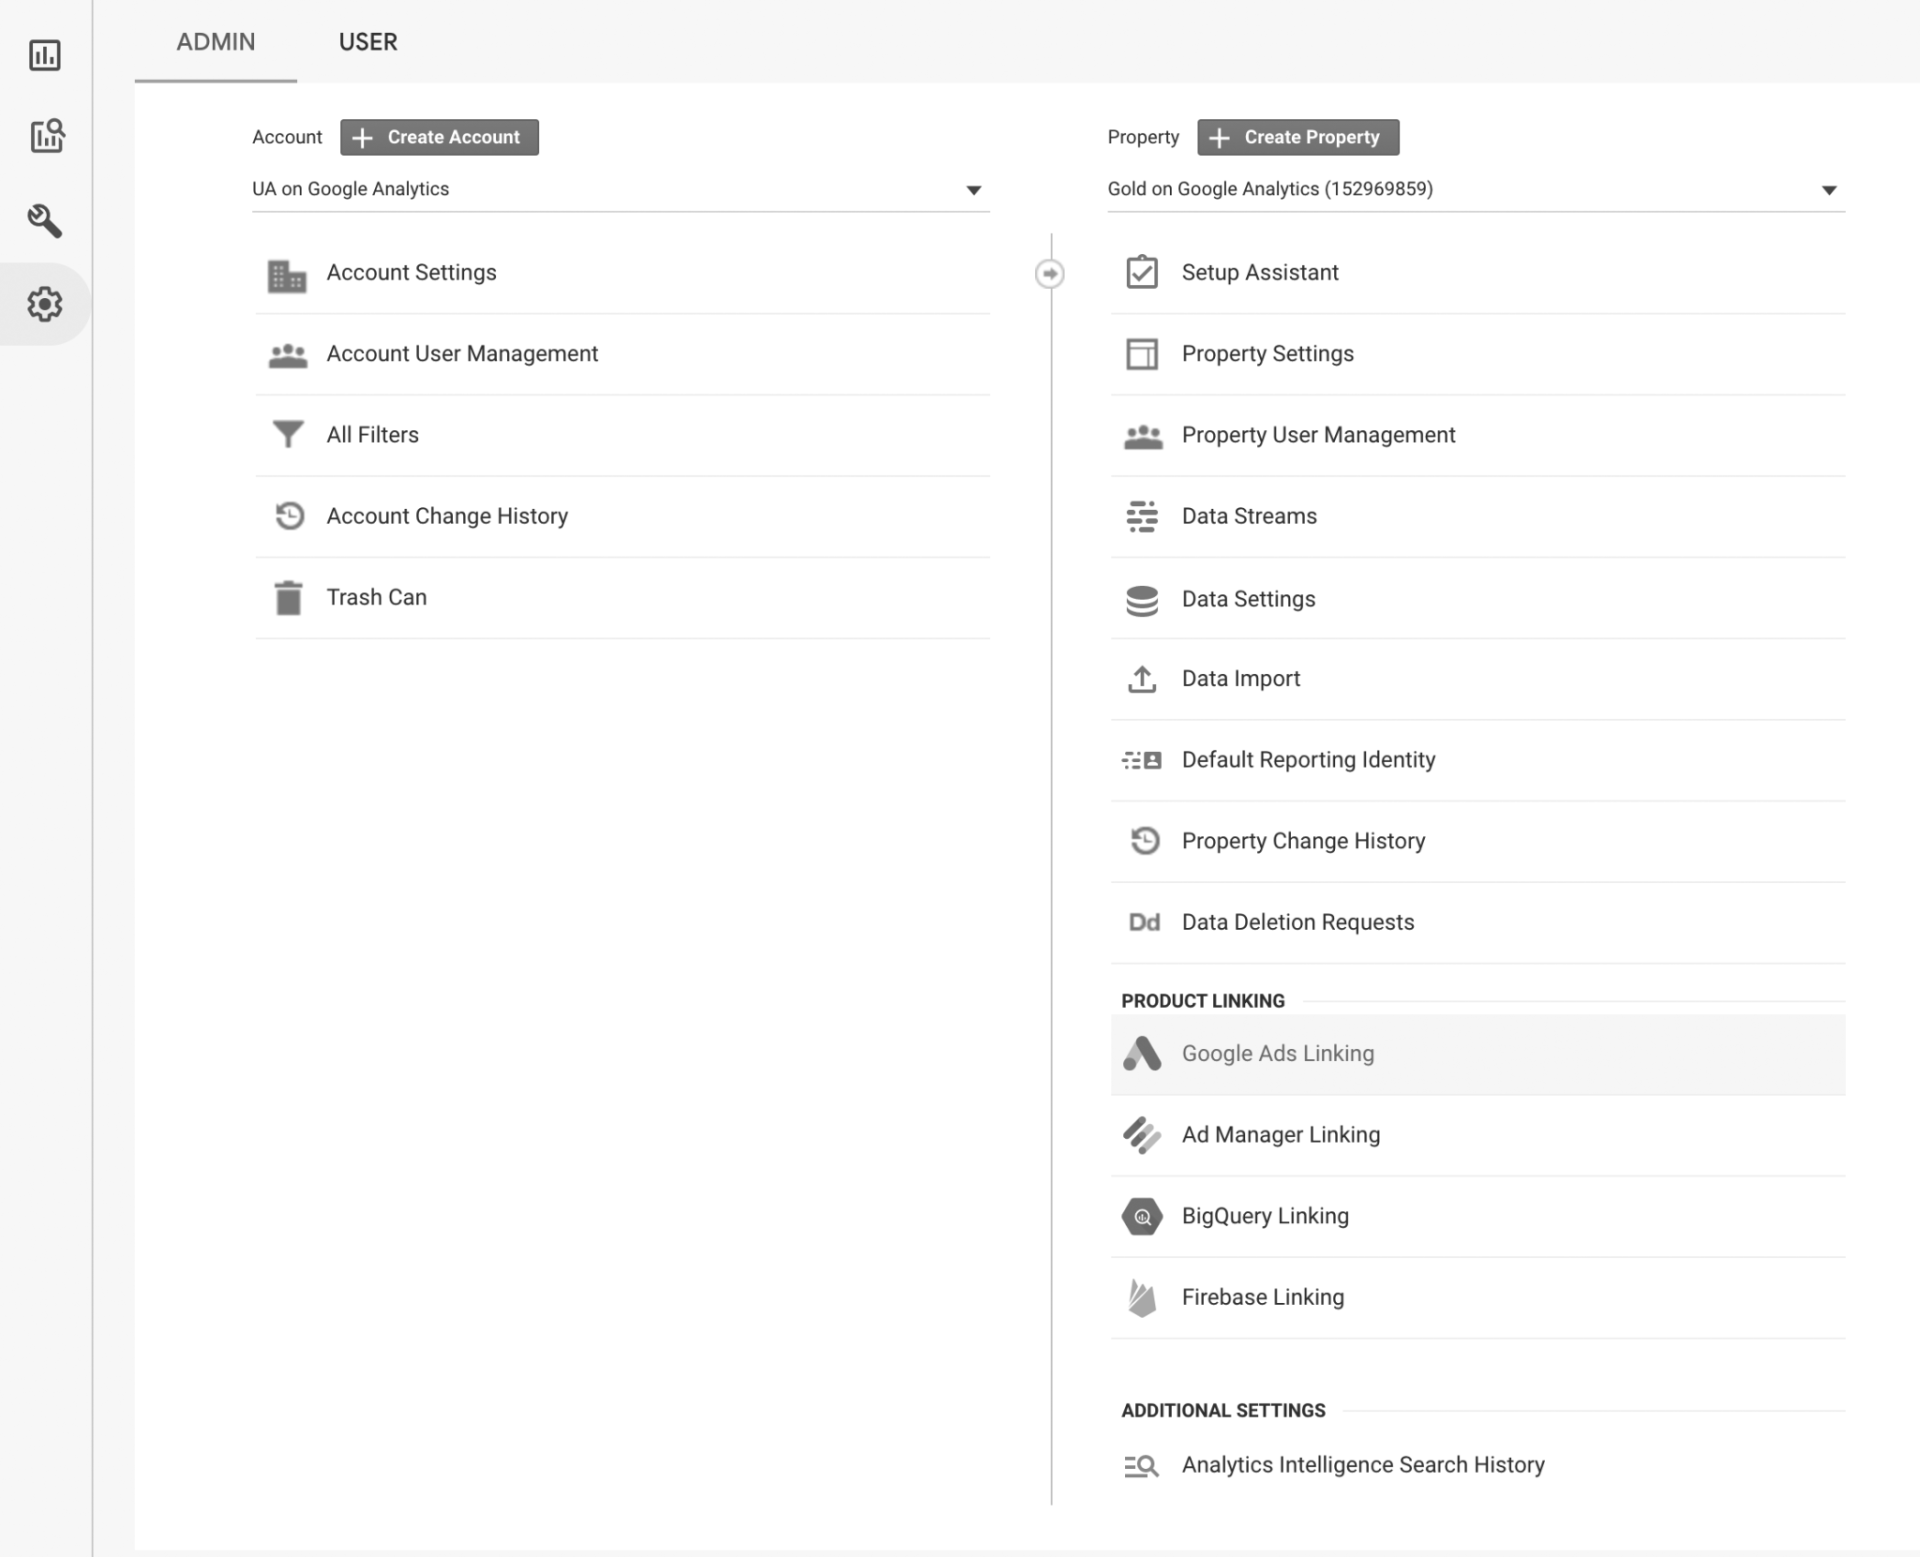
Admin
This page provides all the necessary facilities to manage the various features of Google Analytics 4. To go to this section, click on the admin icon at the bottom of the screen.
This Google Analytics 4 page has different features and options than the Universal Analytics admin page.
For example, the Property column for the Google Analytics 4 admin page includes a link to the data stream that Universal Analytics lacks. Of course, the views column is also a feature of the Universal version, which Google Analytics 4 lacks.
Overview of the admin page in Google Analytics 4
Examining admin features in Google Analytics 4
Account Level Settings
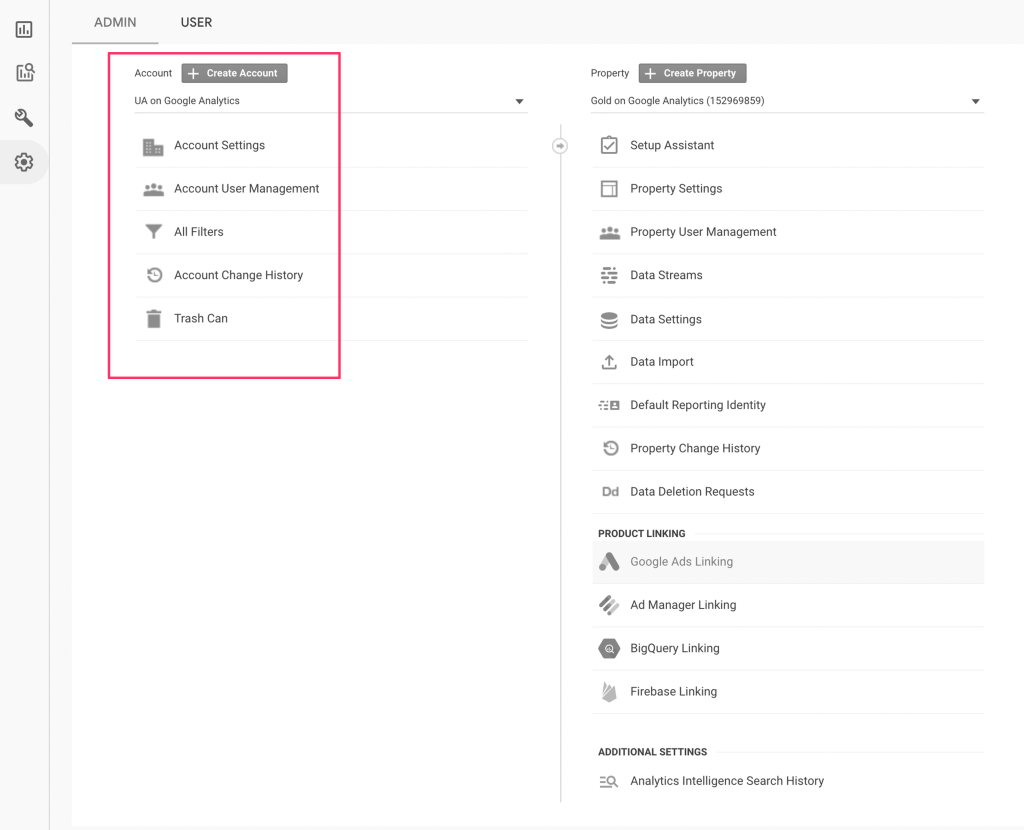
This section is the highest level in the Google Analytics 4 account structure, and all features and views are organized in this section:
Account Settings
The settings related to the Google Analytics 4 user account are made in this section. Initial locations include setting ID and username. After this step, it’s time to choose the information you want to share with Google. This is confidential information to improve Google services, and in total, you have 4 options to choose from:
- Google Products and Services
- Benchmarking
- Technical Support
- Account Specialists
User Management
This essential feature in Google Analytics 4 allows you to give different access levels to different users of your Google Analytics account. For example, suppose you want the site’s content production department members to have access to the reports related to visiting articles, etc.. In that case, you can consider a suitable license for them.
There are four types of licenses:
Manage Users: This level of access allows your team members to add new users, remove new users, and set permissions.
Edit: With this type of permission, the intended user can edit and change all the settings of your Google Analytics account.
Collaborate: This level of access is slightly more limited than the first two. This license, it allows the intended user to collaborate by creating and sharing graphs and personal properties.
Read and Analyze: With this permission, the user can see all the reports related to your Google Analytics account. It is also allowed to analyze the data but cannot edit or change any of the settings. They can also create their own illustrations and property and share it.
Filters
In this section, user-level filters are set. For example, you can remove the IP addresses of your team members from your Google Analytics 4 account so that they are not counted as visitors in your analytics data. Also, remove traffic from ISP domains and addresses you don’t want to affect your analytics.
Change History
This section contains a history of all changes made to your account. For example, to who you gave permission to and the date of changes you made.
Trash Can
Every time something is deleted from an account, it goes straight to the trash and stays there for 35 days before it’s completely deleted. This feature is helpful if you accidentally delete something.
Property Level Settings
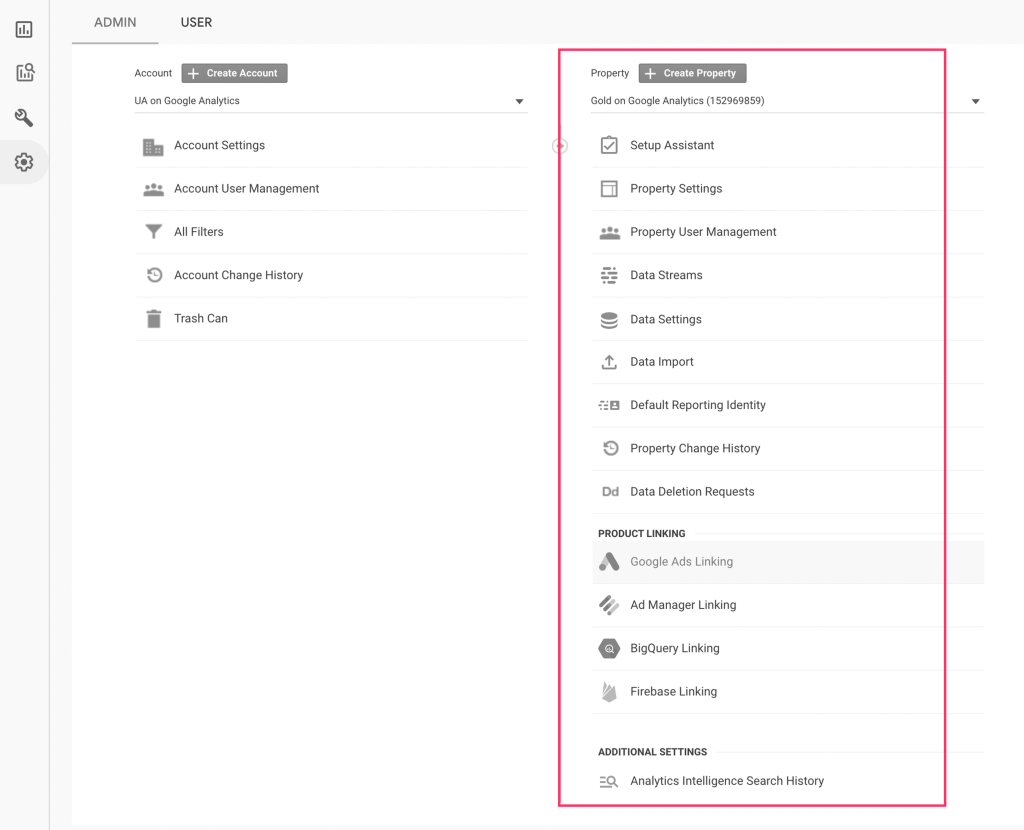
Each user account can have a maximum of 50 properties. Property means the website, blog, subdomain, or mobile app. Each of your properties has a unique identifier and a tracking code that the user account uses to collect data and send it to the appropriate property.
Setup Assistant 1
Setup Assistant is not a configuration section but can be useful when setting up a user account.
This section lets you connect your Universal Analytics account to the new Google Analytics 4 version. Doing this will copy some settings related to your old account to Google Analytics 4.
Setup Assistant provides quick access to the following management features:
- Tag installation / Data streams
- Enhanced measurement
- Google Signals
- Link to Google Ads
- Link to BigQuery
- Audiences
- Conversions
- User management
In summary, this section is handy for learning how to access the essential options and features of Google Analytics 4.
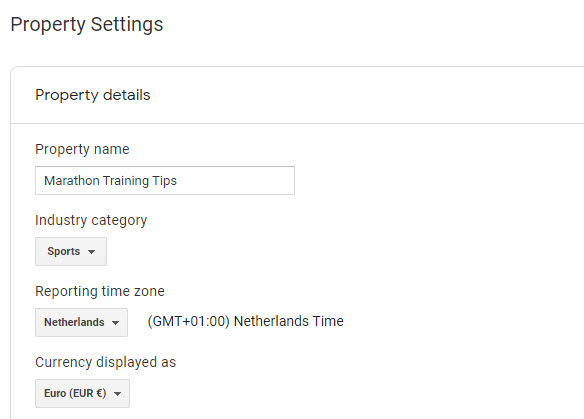
Property Settings 2
In this section, the following can be defined:
Property name: Be sure to choose a name that reflects your business and is easily recognizable.
Industry category: Choose the best type for your business.
Reporting time zone: Set the time zone that best suits your business, and don’t change it later.
Currency: Select the money you have considered for your business.
An example of the Property Settings form:
There are a few other options:
Move property – property transfer to another Google Analytics account
Move Property to Rubbish Bin – remove property
3. Property Access Management
Managing access levels plays a vital role in protecting data and maintaining information security, so be more careful in determining the role of users and their access scope.
Only admins can access this section of Property Settings.
Direct access permissions in Property Google Analytics 4:
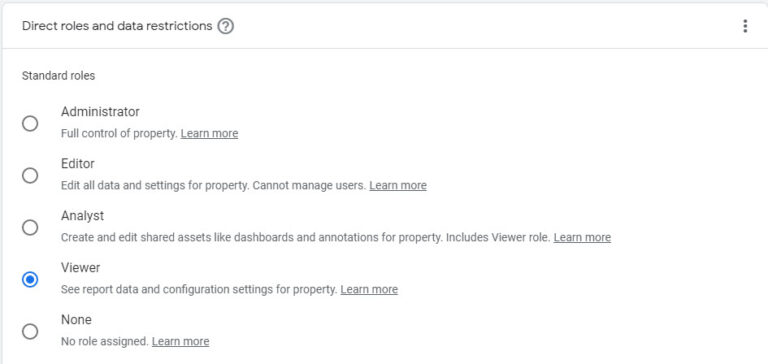
In addition to these options, it is recommended to use other features of this section, such as applying a filter and creating a group of users and make the settings more intelligently.
4. Data Streams
By referring to this section, you can find all the active data streams in your Google Analytics account.
Even using Tagging Settings, you can manage the following:
Modify Events: Change the name of the event
Create Events: Create a new event
Configure Your Domains: Specify multiple domains for cross-domain tracking
Define Internal Traffic: Block internal traffic to eliminate its impact on reports
Define Internal Traffic: Remove unwanted referrals
Adjust Session Timeout: Change and set the start and end time of the session
Using these options, you can define specific settings for a data stream.
5. Data Settings
Data settings can be changed in three different sections: Data Collection, Data Retention, and Data Filters, each of which covers specific operations for data collection and filtering.
6. Data Import
Data Import allows you to upload data from external sources and combine it with data from your Google Analytics account.
Before uploading data, you must first create a data source. A data source is a combination of a CSV file of data and a mapping of the fields in this data.
7. Reporting Identity
This section of Google Analytics 4 refers to how web or app users are identified, and generally, this identification is based on User Id, Google Signals, and Device Id.
Web: Device Id = Client Id
App: Device Id = App-Instance-Id
8. Attribution Settings
This powerful section is included for changing attribution settings. Settings applied to Google Analytics 4 reports.
Cross-Channel Last Click, Ads-Preferred Last Click, First Click, Last Click, and… are the models considered for this attribution.
9. Property Change History
This section provides a history of all Property level settings, and when necessary, using the information in this section can be very useful.
10. Data Deletion Requests
This feature is used to delete data from the server, and to register this type of request; you must have the role of admin or editor.
11. Google Ads Linking
Linking Google Ads to Google Analytics 4 account is very easy. To do this, you must have the role of administrator or editor. The following are the main benefits of this action:
Review the status of advertising campaigns in Acquisition reports
Access to the new dimensions of Google Ads in the User Acquisition report
Import conversion analysis to Google Ads account
12. Ad Manager Linking
This section is often used by people who advertise their products or services on a large scale.
13. Bigquery Linking
Bigquery Linking, one of the most excellent new features of Google Analytics 4, is free. This feature lets you easily connect your Google Analytics 4 Property to Bigquery.
Bigquery has unlimited analytical possibilities, and the most important advantages of using this tool include the following:
- No sampling
- Unlimited dimensions
- Calculation of total completed goals
- Correcting errors in collected data
- Combining Google Analytics 4 data with other data sources
14. Search Console Linking
Using this tool, you can connect your Google Analytics 4 account to Search Console and get more reports about your site’s SEO. To apply this feature, you must have the role of editor in the desired Property.
15. Analytics Intelligent History
This history is saved for better personalization of the search results of the analysis performed. Users with the editor or admin role can delete the activities in this section.
Conclusion
Google Analytics 4 is a beautiful analytical tool that helps business owners to analyze data related to traffic, user interaction, visits, etc., more smartly by providing extraordinary features and facilities. The reports obtained from these analyses play an important role in setting goals for the future. It is enough to create your user account, and using the explanations provided in this article, you can use the facilities on this platform effectively and optimally. After that, you will notice the progress and success that has come from knowing more about the performance of the site or application.
Many problems can deter users from visiting your site and visiting your products and services. Issues such as low site speed make the user discouraged from continuing.