The best air pollution reporting applications
Viewing weather information and pollution reports is essential for many people. This article introduces the best applications for checking the air pollution situation.
These days, we are so used to rapid weather changes that it is always better to know about these changes early. Various programs provide other helpful information in addition to weather forecasting. Not all weather programs report the same data; In this article, we will introduce the best examples.
Some people urgently need information about this due to their sensitivity to some pollutants that are usually present in the air. The list of the best weather apps provides you with beneficial information to plan and be ready for all conditions by checking the weather conditions.
Before we go through the best weather reporting apps list, let’s talk about the air pollution index first.
What is the air pollution index, and how is it determined?
Raw data can be challenging to understand when measuring air pollution, and air quality indicators were created for that reason. The Air Quality Index (AQI) converts numerical data into a descriptive rating scale and makes it easier for citizens of all ages to understand the extent of breathing air pollution.
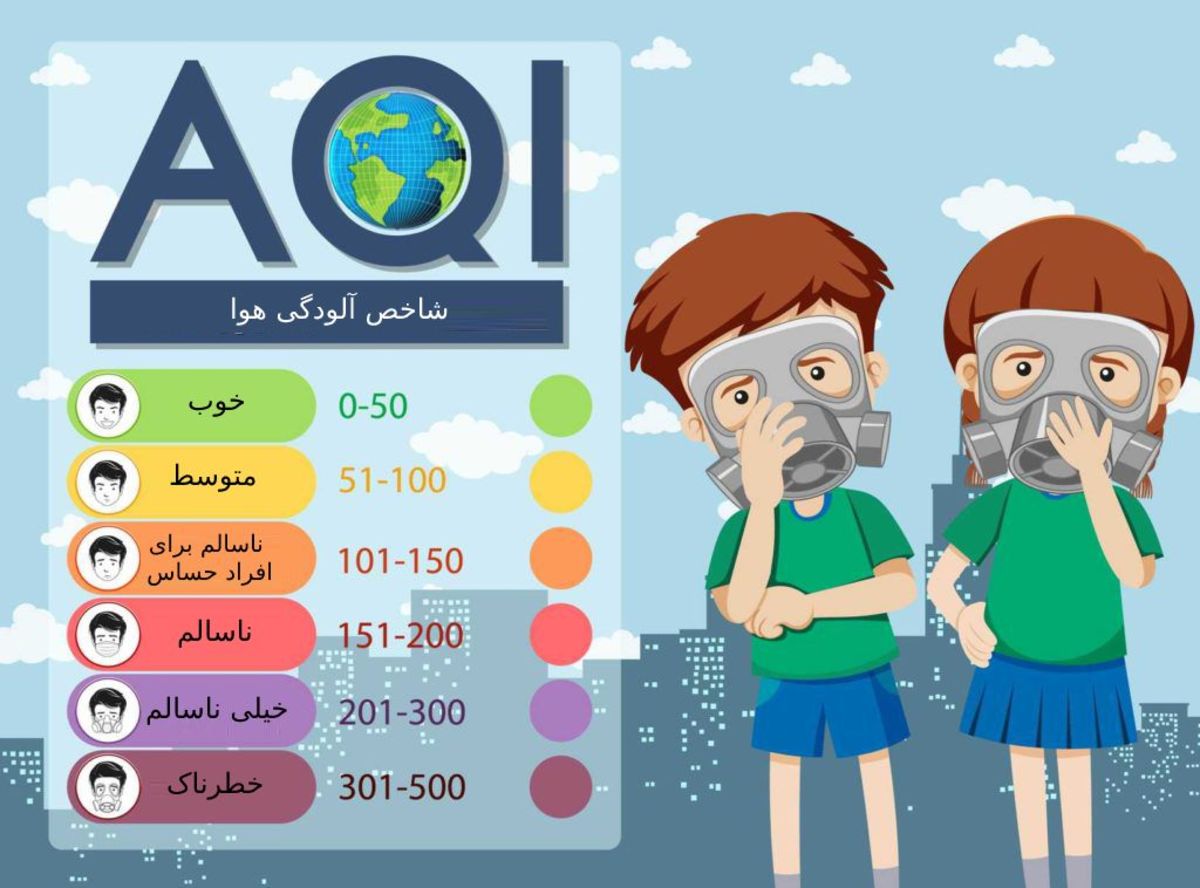
The air quality index is a scale used to indicate the level of air pollution and the risks associated with each rating. AQI is calculated using established standards based on medical research for acceptable levels of major air pollutants.
Air quality indicators serve two primary purposes:
- They are informing the public about air quality in an understandable way so that they can take the necessary measures to protect their health.
- Helping countries develop and evaluate better air quality policies.
Different government agencies use many air quality indicators; However, none of the AQIs include air quality parameters for all periods.
How to calculate the air pollution index
Air pollutants come from various sources, such as fossil fuels in vehicles and cooking, and natural sources, such as dust storms and smoke from fires and volcanoes.
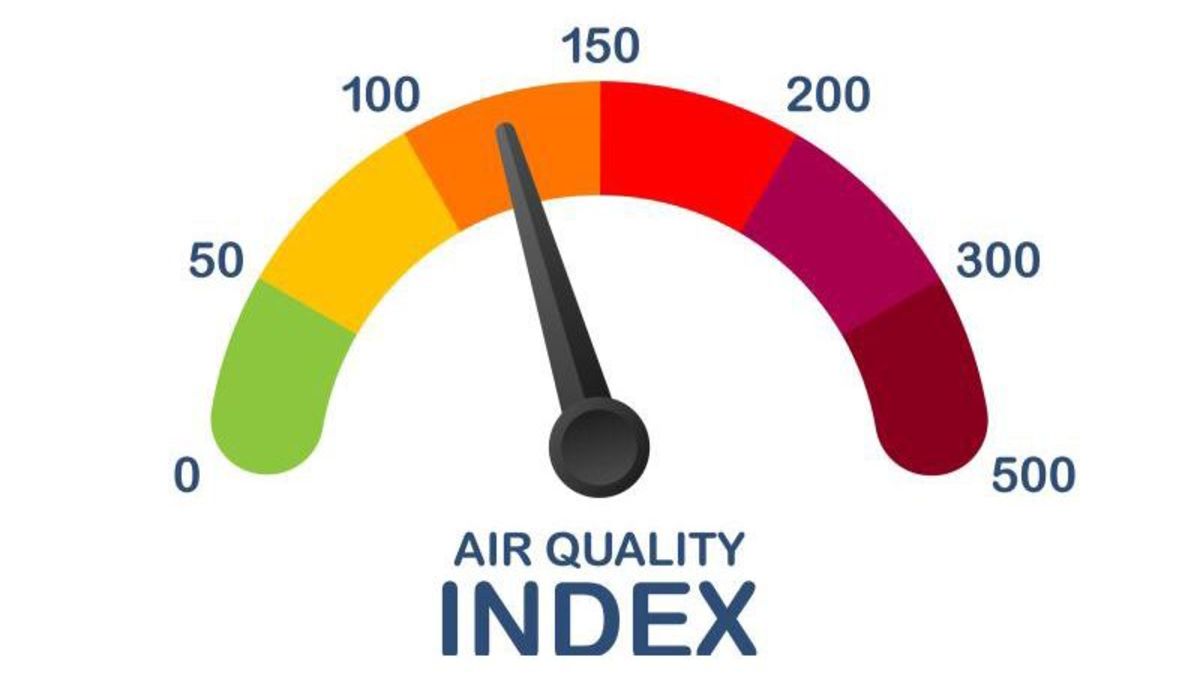 The air pollution index is measured in the range of 0 to 500
Air quality monitoring systems use special sensors to identify specific pollutants. Some use lasers to scan the density of particulate matter in a square meter of air. In contrast, others rely on satellite imaging to measure energy reflected or emitted from the ground.
Pollutants related to human health and environmental effects include PM10, PM2.5, ground-level ozone, nitrogen, and carbon dioxide. The higher the concentration of contaminants in the air, the higher the air quality index (AQI). We must mention that this scale is determined in the range of 0 to 500. When the AQI shows a figure of 50 or less, it means that the pollution level is less dangerous, while figures above 100 are considered unhealthy. According to UNEP, only 38 out of 117 countries and regions worldwide had a healthy average AQI in 2021.
How to calculate air quality
Air quality databases process readings from government air quality monitoring systems and crowdsourced and satellite sources to derive an AQI number. These databases can consider data with different weights based on reliability and the type of pollution measured.
For example, UNEP, in collaboration with IQAir, launched the first air pollution exposure calculator that provides live data in 2021, A tool that combines global readings from air quality monitoring systems at 6,475 locations in 117 countries and regions around the world. This database prioritizes PM2.5 readings and uses artificial intelligence to calculate the population’s exposure to air pollution in hourly time frames.
Tehran air quality application
In the following, we introduce the best air quality monitoring programs in Tehran. Of course, some of these applications also show the level of pollution in other parts of the country.
The country’s air quality monitoring system
The country’s air quality monitoring system program shows the air quality index of all environmental stations in Iran by province, including Tehran.
Another part of this application is designed to provide information about the air quality index of each station on the map. The first page of this program displays the average index of the stations of the provinces, and on the second page, the index of different pollutants is displayed by station and in the form of a graph. Additionally, the program settings section provides guidance on data index and timing.
Download the Android version
Download the iOS version
Air quality in Tehran
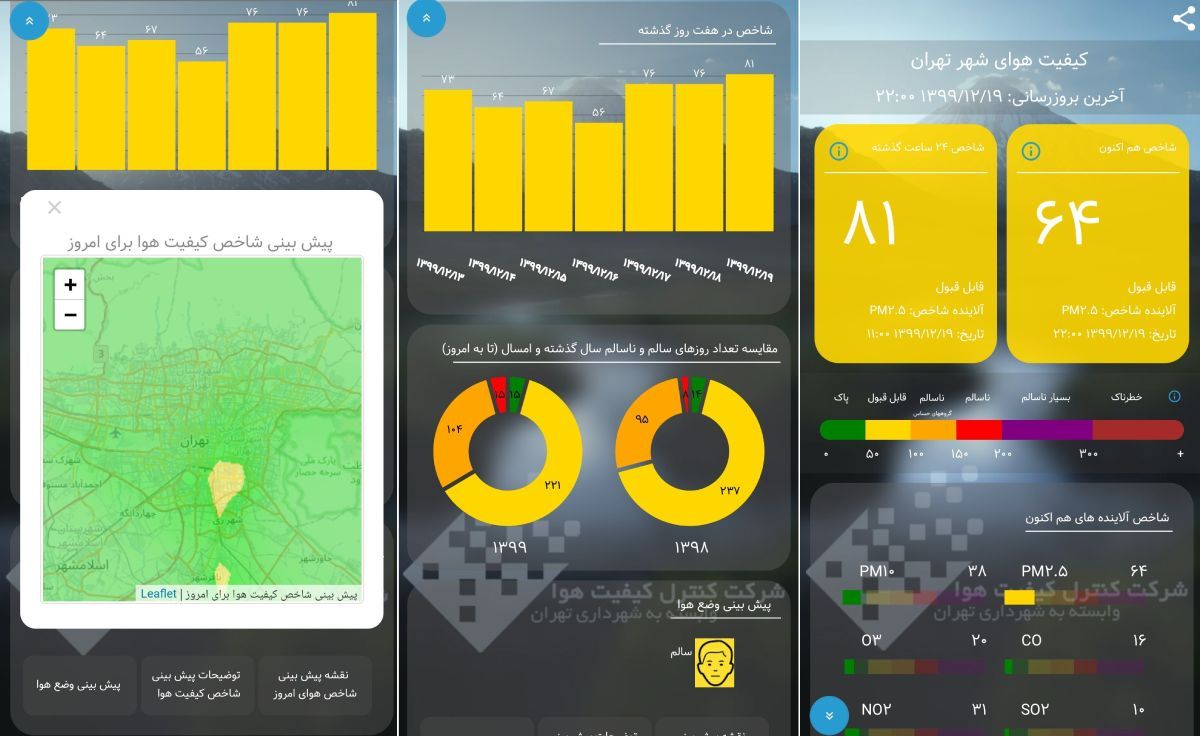
Tehran air quality program provides air quality information to citizens. Among the capabilities of the mentioned application, it is possible to say the display of the air quality index by stations, the collection of the quality index of stations on the map of Tehran, the group of the air quality index in the days of the last week, and other cases.
Tehran’s air quality application also provides analysis and forecasts according to the conditions of the pollution index. In addition, it compares the number of days when the air was healthy with the number of days when the air was assessed as unhealthy. The app also provides weather conditions along with a forecast map of weather indicators for the current day.
Download the Android version
Tehran Air
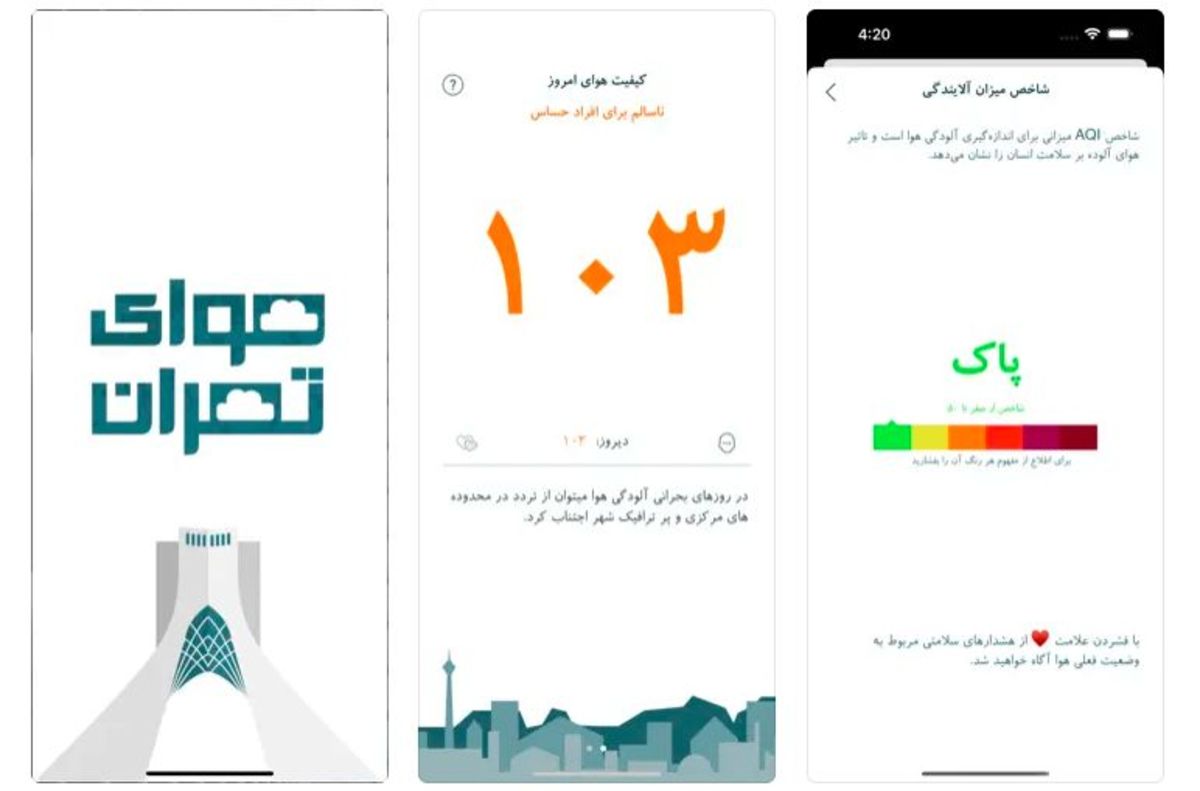
Tehran is one of the largest cities in the world, and the millions of people who live in it have always faced air pollution problems, and many days of the year, we see a lot of pollution and unhealthy air in this city. Thus, knowing the amount of pollution in real-time can help you take the necessary measures to protect your health.
Tehran Air program helps you to view the data related to the level of air pollution in Tehran and the concentration of different pollutants. The app also provides monthly and weekly graphs of air quality. Other attractive features of this application include health warnings about the current weather state, scientific tips and facts about air pollution, and more.
The best air pollution app for Android and iOS
In the following, we have prepared a list of the best foreign programs for checking air pollution. These apps are available for Android and iOS operating systems.
IQAir AirVisual
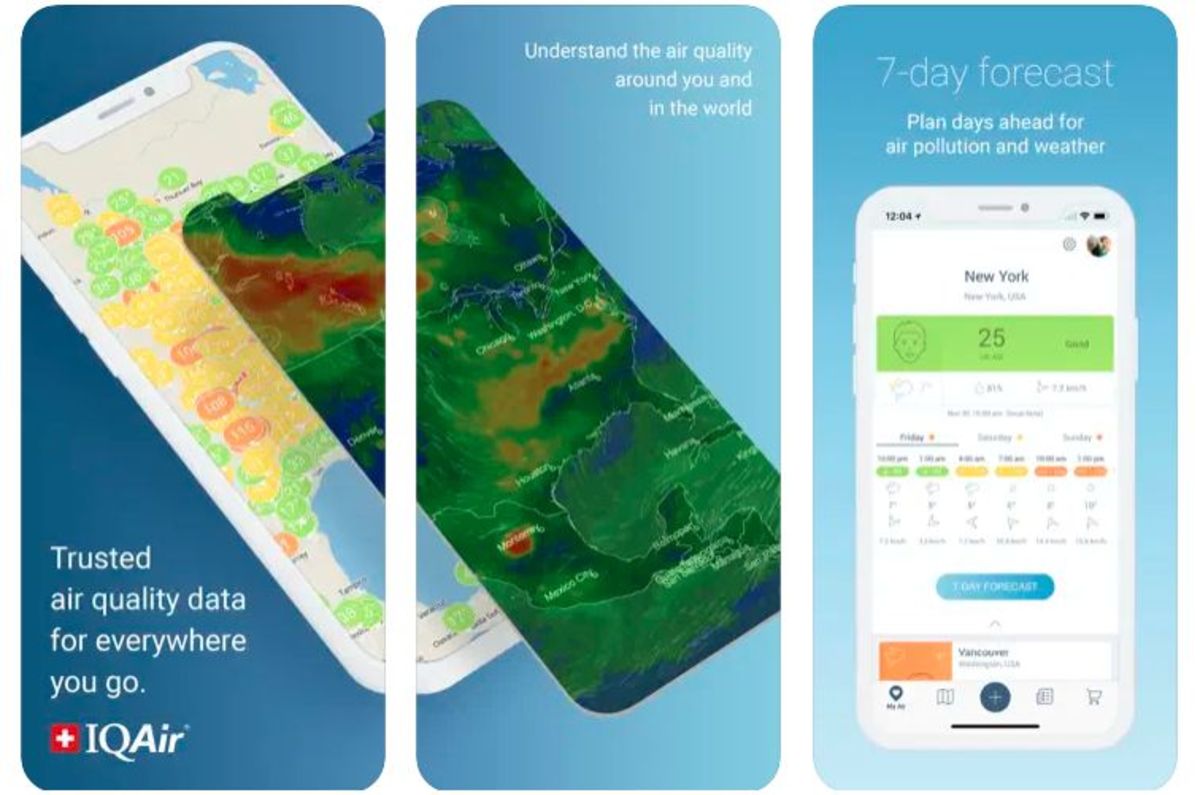
IQAir AirVisual provides users with the most reliable air quality information from the world’s leading providers of air pollution data. Coverage of more than 10,000 locations from the global network of government monitoring stations and certified AirVisual sensors is one of the attractive features of this program.
The IQAir AirVisual program provides 2D and 3D maps of global pollution and can be used to view real-time pollution indicators worldwide. Among the exciting features of IQAir AirVisual are historical data, real-time data, and air pollution forecasts. The app also predicts the weather conditions for the next seven days so that you can take necessary precautions accordingly.
IQAir AirVisual also displays necessary health recommendations for air pollution and provides standard weather data, such as temperature, humidity, wind, etc., with high accuracy.
Download for Android
Download for IOS
AirMatters
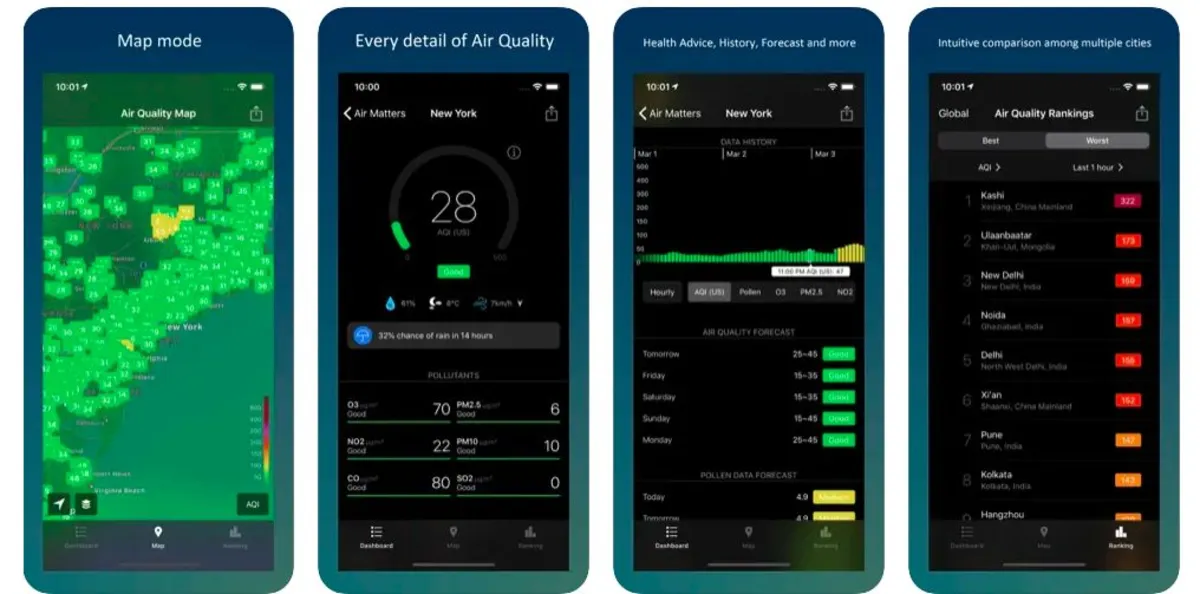
One of the most popular air pollution reporting apps for smartphones is AirMatters. This powerful application offers easy and visual tracking of the air pollution index. This tool has many of the basics of IQAir, including the ability to check overall AQI and provide more in-depth reports.
AirMatters turns complex readings into recommendations that anyone can easily understand. For example, this app has a whole section for health advice that advises the user to wear a mask if necessary.
Depending on the amount of data provided for where you live, it may also be possible to check for allergy-related factors in AirMatters. For example, levels of birch, pollen, grass, mugwort, and ragweed are just some of the things that are controlled in certain areas.
Download the Android version
Download the iOS version
Plume Labs
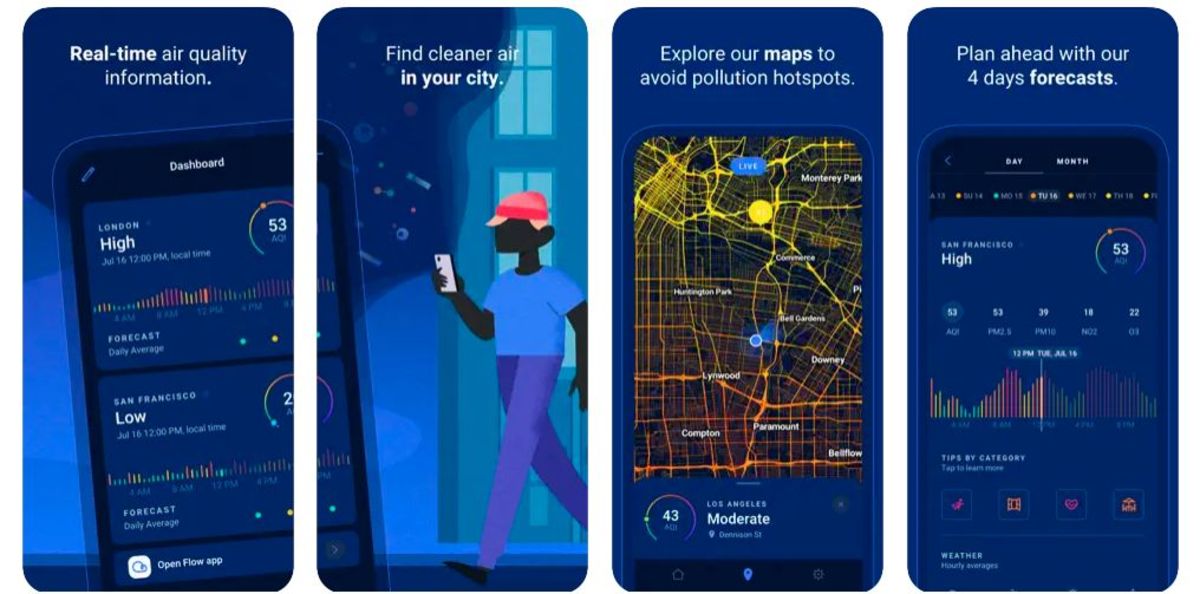
Another top pick on this list is Plume Labs, which makes air quality monitoring systems just like IQAir. One of the advantages of this program is the lack of ads. Of course, several advertisements from other products of this application are sometimes displayed to users.
Another feature of Plume Labs is the simplicity of its user interface. This program uses a modern and simple appearance, and it may seem that it does not have special features at first glance. Still, the mentioned application provides information about the main types of pollutants and graphic charts of the forecast history. In addition, according to the air quality, it gives recommendations for agreeing or disagreeing with some outdoor activities.
Plume Labs also displays data on the best and worst days of the year in terms of AQI and annual averages.
Download the Android version
Download the iOS version
BreezoMeter
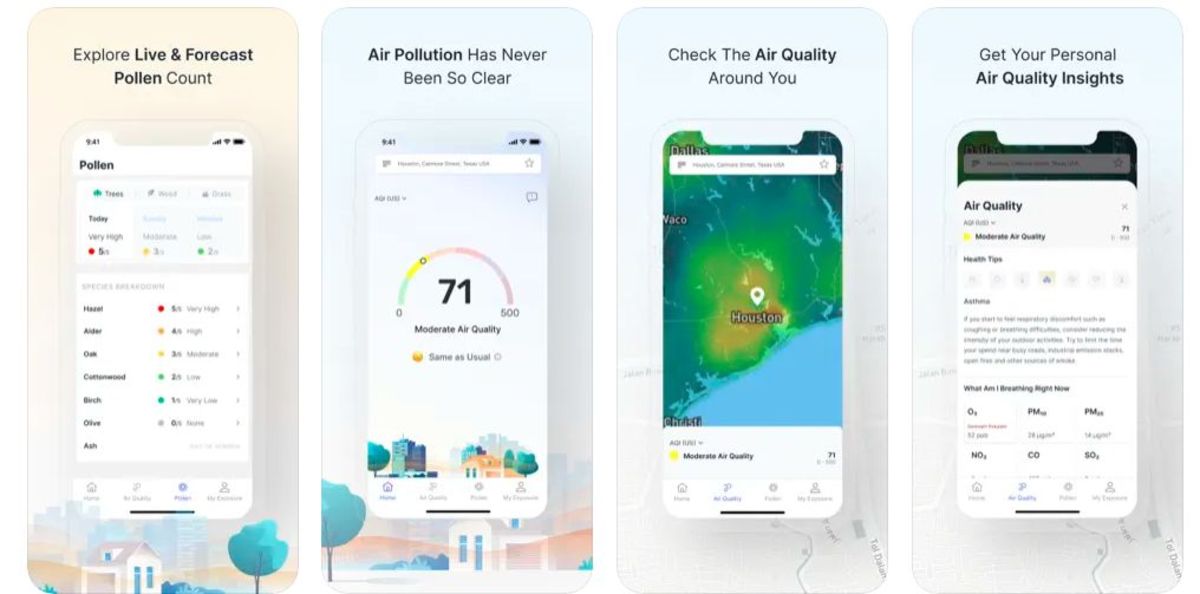
One of the famous programs to check the amount of air pollution is Breezometer. This application looks deceptively simple and, of course, has an attractive user interface. It is worth noting that this program, like many similar examples, lacks visual information and focuses more on conveying information through various optical elements.
Breezometer might not be for you if you rely on graphs to browse data, but it will appeal to some people who like modern apps.
On the main page of Breezometer, there is a section to display the AQI measure, which provides the overall air quality. Most users use air pollution reporting programs to view the figure of this measure.
By selecting the Air Quality button, you can enter the details page and see more information about air pollution. This section contains details about SO2, NO2, CO, PM2.5, PM10, and O3 but does not show the history of this pollutant for previous days.

