


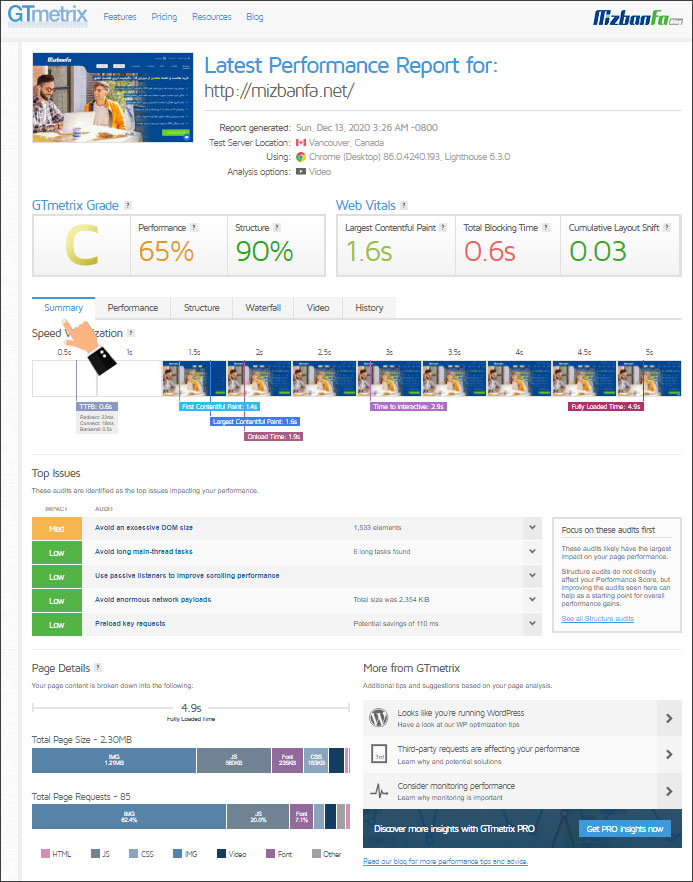
Website analysis with the Summary tab in GTmetrix
In order to set up a website, you need to take certain steps from providing hosting and domains such as hosting for a WordPress site to choosing the right content management system and installing a template on the site . But you should keep in mind in all these steps that nothing can affect your performance as much as how you manage your website. You must set up an optimized and high-speed website and manage it in a proper way so that you can promote your internet business. In this regard, fortunately, it is possible to use various tools and capabilities that will help you gain a better understanding of the state of your website. One of the most important of these tools, which is highly popular among people, is the Gtmetrix site. The analysis of GTmetrix of the site plays an important role in improving its performance in terms of speed. Because by using the information provided on this website, you can easily start improving the speed of your website. The previous articles on the complete training of site analysis with the new GTMETRIX also discussed how to register in GTmetrix + introduction of different types of accounts. As you know, in this online site analysis tool, various information is provided to users, and an important part of this information is placed in the GT Metrics Summary tab. In this article from the Fa host knowledge base, we have decided to examine GT Metrics’ Summary tab and how to measure site speed using it.
The topics covered in this article are as follows:
- How to analyze GT metrics

- Check the information provided in the Summary tab of GT Metrics
Site analysis with GTmetrix
The first tab you will come across when analyzing the desired page of your website is the Summary tab. This tab, which was recently added to the new gtmetrix website, provides a complete description of of the reviewed page in terms of speed, possible problems, and page details such as its size or number of requests. The Summary tab can be considered a very suitable measure for analyzing and improving website performance in order to increase speed. In the following, we will give a complete description of this tab to analyze the website.
A significant issue that should be taken into account when analyzing the website regarding the Summary tab is that due to the newness of this tab and also the provision of analytical information of the desired page in different categories, you need to Familiarize yourself with the above tab and its categories. If you pass this step well and know enough, you can finally optimize your website in a more specialized way and give your website users a much faster loading speed. If you want to get familiar with the Summary tab of GT Metrics and how to analyze the website, follow us until the end of this article.
Check the information provided in the Summary tab of GT Metrics
In general, when trying to analyze and analyze the summary website in GTMETRIX, you will face 3 general categories. Each of these categories provides different information about the performance, structure, loading speed, size and number of requests of the page under review. As a result, you need to familiarize yourself more with the sections and the information they provide. The categories available in the GT Matrix Summary tab are:
- Speed Visualization
- Top Issues
- Page Details
In the following, we will examine each of them in more detail
1- The Speed Visualization section of the Summary tab of Jiti Matrix
One of the new sections where you can better analyze the GT metrics of the desired page and measure the speed of the site by using the information placed in it, is the Speed Visualization section. In this section, you will be able to view the loading speed of your website visually. In fact, you can see the experience of your users when trying to enter the desired page and the time it takes for the page to load completely. This will help you get a better understanding of the various information and statistics that will be presented to you during the GTMetrics analysis of the page in question. In the next tutorials, you will get to know all the terms used in Jitimetrics analysis.

2- Top Issues section of the Summary tab
If you want to know which are the main problems that affect the performance of your website in terms of speed, you should proceed through this section of the GT Metrics Summary tab. In this section, you can identify the types of problems on the desired page and the extent of its impact on the loading speed of that page, and even fix them using the provided tips and instructions. Usually, the problems that are placed in the Top Issues section have more priority than other problems, and by solving them, it is possible to increase the loading speed of the desired page in an optimal way.
The errors that are placed in this section are divided according to the amount of impact they have on the performance of the website from GT Metrics. This will help you a lot while trying to analyze the website. Keep in mind that you can analyze the problems and errors of the desired page in a better way according to the Impact option and the coloring of this section.

These categories are based on the impact they have on the intended page:
- High : This part, which is marked with a bold red color, indicates that the mentioned error has the greatest impact on the speed and performance of the page under review.
- Med-High : The severity of the errors that are marked with this title and brown color is less compared to the previous case. But they are still among the priorities for improving the target page that you should pay attention to when analyzing the site’s GTmetrix.
- Med : Errors that are not the main priority, but have a relative impact on the speed of the page under review, are placed in this category and marked with orange color.
- Med-Low : This category of errors, which are characterized by a pale green color, have a lower priority compared to the previous categories. You can come to them after fixing the previous errors.
- Low : The lowest priority among all the main errors displayed in the Summary tab is shown in this category. This category is shown in green and can be your last choice for GTMetrix analysis of the page you want in the list of main errors