


Checking the performance of the site with the Performance tab in gtmetrix
Buying a high-quality website hosting service such as Iran’s cheap hosting is one of the most important measures that should be taken into account for setting up a website, which has the highest impact on the performance of your website, but keeps in mind that if the website is not optimized, all your efforts will be fruitless. will be. One of the most important measures you can take to improve your website’s conditions is to check the site’s performance in terms of speed, and now the Gtmetrix website provides you with this possibility. In the new version of Jiti Metrics, we see new changes. These changes are mainly related to the analysis of different parts of the site. New sections in the Performance tab of JitiMetrix provide a detailed analysis of your website. In previous tutorials, how to analyze the site with the new GTMETRIX. If you want to learn the Performance tab in Gtmetrix and its role in improving the site’s performance at the end of this article from the Fa host knowledge base.
In the new Giti Metrics, we come across many terms. At first glance, they may be hard and complicated and incomprehensible, but these numbers and figures greatly help improve the site’s performance. Below is a list of new Jitimetrics terms, which we will describe in detail:
- Performance Metrics
- First Contenful Paint
- Time to Interactive
- Speed Index
- Total Blocking Time
- Largest Contentful Paint
- Cumulative Layout Shift
- Browser Timings
- Redirect Duration

- Connection Duration
- Backend Duration
- What is Time to First Byte or TTFB?
- First Paint
- What is DOM?
- DOM Interactive Time
- DOM Content Loaded Time
- Onload Time
- Fully Loaded Time
As mentioned earlier, the Performance tab in Gtmetrix is used to analyze the efficiency and performance of the site. This section includes the following two parts, which will be explained in detail below:
- Performance Metrics: Key factors in site performance
- Browser Timings: effective factors in loading and communicating with the audience and the browser

1- Performance Metrics
When you click on the Performance tab in gtmetrix, the first section you will come across is the Performance Metrics section. In this section, you can see the main criteria related to the speed of the site and check the performance of the page you have analyzed. In the following, we will define each of these criteria and new terms of Jitimetrics in detail and examine its role in the performance of the site.
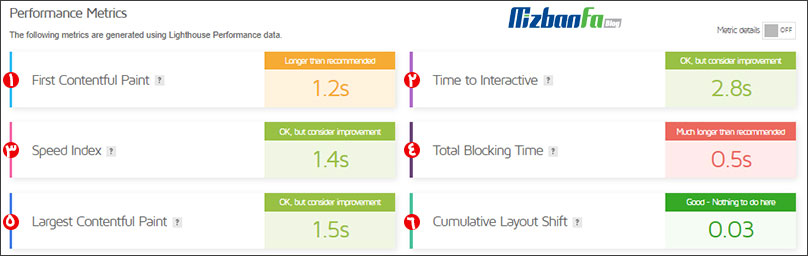
1. First Contentful Paint
term Contentful First The Paint FCP refers to when the first text or image content or canvas elements of your website page is displayed. This time plays an important role in checking the performance of the site because the shorter the content of the page is displayed, the better user experience is provided for the visitors of that page. Because the First Contentful Paint on content, you can gain a better understanding of what your users are seeing when they first land on the page they’re looking at on your website. This allows you to improve the performance of your site in a better way according to the user experience that is provided. In the following, we will explain this topic more clearly by mentioning an example.
2. Time to Interactive
Another term mentioned in this section of the Performance tab in Gtmetrix is TTI. TTI stands for Interactive to Time and measures considered of page loading responsiveness. In fact, this metric shows you how much time it takes for a page to be in a state where it can have constructive interaction with the visitor. In the discussion of site performance, the slower the TTI of your website pages, the less responsive your website visitors are, and this causes them to have a negative user experience. You may be interested to know that if the most valuable content on your page is exactly the longest content on the page, it can be inferred that your page has performed the best possible in terms of Time to Interactive.
3. Speed Index
is SI Gtmetrix Speed or Index . This metric actually shows you how long it takes for the top half of the page to be fully loaded and plays an important role in evaluating site performance. SI depends on many things including browser size, FCP, or LCP, and is not a measure of page load timeline by itself. In fact, SI is a computational conclusion that is obtained by analyzing and analyzing several criteria.
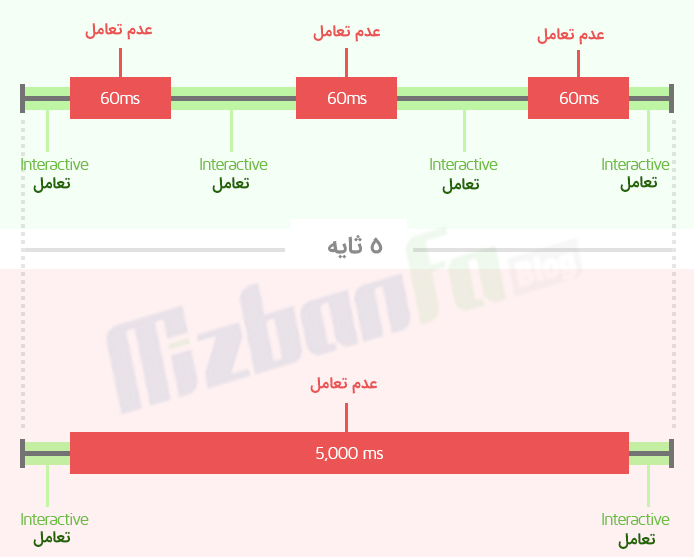
4. Total Blocking Time
or . Total Blocking Time introduced TBT is by Lighthouse in 2020 and is one of the new Jitimetrics terms This measure quantitatively examines the responsiveness of your website’s page load to incoming users. In simpler terms, TBT calculates and provides you with the total time that your web page is blocked and as a result, users are prevented from interacting with your website.
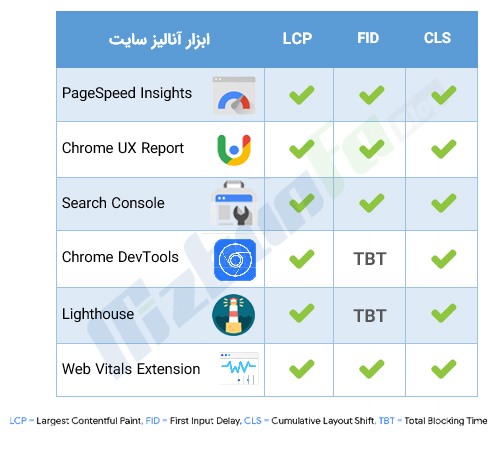
This is a very key metric in evaluating site performance. It is considered one of the cases that is displayed in the Web Vital section in the Summary tab of GT Metrics and is an alternative to the FID or First Input Delay in the PageSpeed tab of the previous GT Metrics. As mentioned earlier, TBT is one of the new terms of gtMetrix. In the picture above, you can see the types of analytical tools that are presented in some reports called TBT and in others FID.
5. Largest Contentful Paint
LCP is one of the new terms of Jiti Metrics. stands for L argest Contentful Paint LCP , which means displaying the largest content on the page. This term was introduced by Lighthouse in 2020 and it helps you to do better in the field of site performance review and accurately evaluate the user experience of your website visitors in terms of page loading speed. This measure shows you how much time it takes to display the largest content of the desired page, such as text, images, etc., to users. The shorter this content is displayed to visitors, the more likely you are to gain credibility with your users.
6. Cumulative Layout Shift
Another new term of JT Metrics and the last measure you will encounter in the Performance Metrics section of GT Metrics is CLS. This term is an abbreviation Cumulative Layout Shift Lighthouse 2020 introduced and is a measure to measure the visual stability of the page during loading time. In other words, CLS checks what unexpected changes happen to the page elements when the page is loaded. Due to the important role that this metric of the Performance tab in Gtmetrix has in providing a pleasant user experience, it is known as one of the important metrics for checking the site’s performance and is also mentioned in the Web Vitals section