
Training Of Basic Statistical Functions In Spss Software (Or Statistics Functions)
In this post , we will teach you all the main statistical functions in SPSS software , which are called statistical functions for short.
Introduction
This topic introduces you to the basic statistical functions. These functions are basically used with the COMPUTE and if commands. All of these functions are applied between several variables (or horizontal functions).
See AGGREGATE for univariate functions. We recommend that you follow us by downloading and opening the statistical sample program (hospital) .
Top: Inside the collected topics Bottom: Inside the collected topics
SPSS Statistical Functions – Unknown Values
If all data is unknown, they report unknown values. If one of the inputs is known, the output will also be known. This is true for all the functions we study here. Does not apply to numerical functions. For these functions, if all values are known, only one known value is reported.
Statistical functions of SPSS point operators
The smallest number of known data is assigned to these functions. For example command:
compute mean_v = mean.3 (v1 to v5).
Which calculates the data middle for at least 3 known values from v1 to v5. In cases where the known values are less than 3, an unknown value is obtained for the middle. The point operator can be used for all functions of this topic. Although this operator is less known among users, but it has a very important feature.
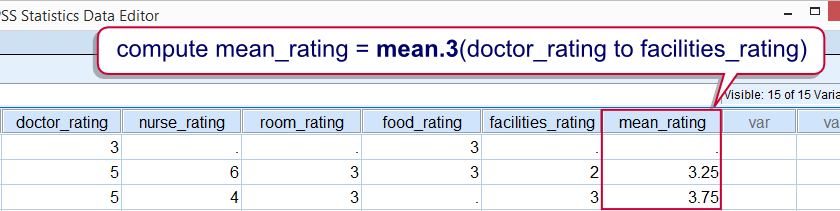
The average rate is 3 (physician to facility ratio)
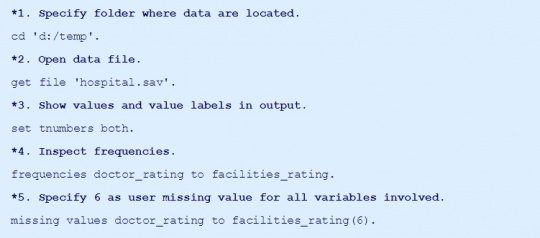
Data preparation
We use 5 variables from the data. If we do not specify unknown values, incorrect result may be reported for the functions. Therefore, we perform a complete review of the FREQUENCIES command. 1. Select the folder where the data is located. 2- Open the data file 3- Show the values and the data label in the output. 4- We check the data sequence. 5. Select the number 6 as the unknown value from the input values.
SPSS MEAN function
Intermediates are reported by the SPSS MEAN function. If we have unknown data, the sum of known values is divided by their number. Execute the following command:
![]()
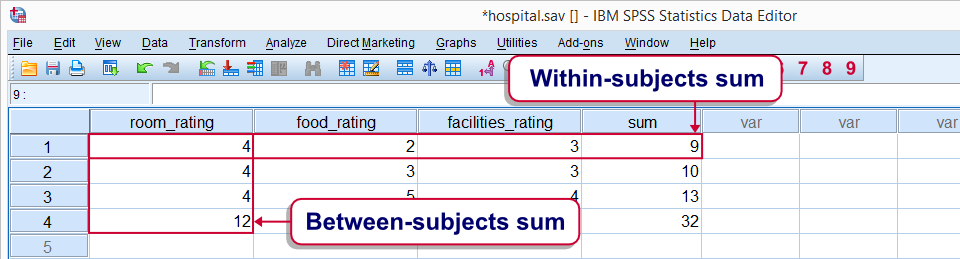
SPSS SUM function
This function provides the sum of all variables. In the presence of unknown variables, the sum of known values is reported. In this case, the result may be somewhat misleading, and the calculation is as follows:
![]()
SPSS MIN function
This function finds the smallest value of the data. Usually we use this function for discrete or numerical data, but it is also technically used for continuous variables. Command of this function:
![]()
SPSS MAX function
This function finds the largest data among the variables. Like the MIN function, it can be used for continuous variables. Function command:
![]()
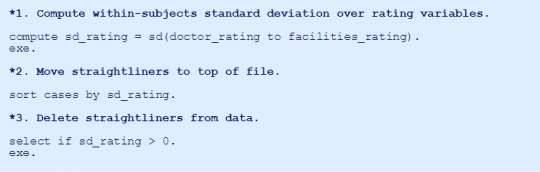
SPSS SD function
The standard deviation of a batch of variables is reported by the SPSS SD function. This standard deviation can be easily used to detect non-scattering (zero scattering). For example, if all the respondents answer all the questions in the same way, the calculated standard deviation for the question will be zero. Maybe because the question in question does not have a definite answer. In such cases, this type of question and answer should be excluded from statistical analysis.
Sample instruction for executing SPSS SD function:
- Calculate the standard deviation of the input variables.
- Move the zero scatter to the top of the file.
- Remove zero scatter from data.
SPSS VARIANCE function
Calculates the variance of variables. This square function is a standard deviation function. The following command:
![]()
SPSS MEDIAN function
Finally, we calculate the average of the data from the MEDIAN function. Command: