
Pandas, a must-learn library for any data scientist
Pandas Is An Open Source Library Used To Interact With Relational Or Tagged Data Directly.
Pandas provide various structures and functions for manipulating numeric and time series data.
This library interacts closely with the NumPy library, so it is recommended to learn how to work with both libraries for machine learning projects. The main strength of Pandas is their speed and high performance.
The panda’s package is one of the most important tools available today to data scientists and analysts proficient in Python.
When it comes to machine learning and data science, all eyes are on the visualization tools companies provide to developers. Still, the reality is that Pandas is the backbone of most data-driven projects.
A brief history of pandas
Pandas were initially developed by Wes McKinney in 2008 while working at QAR Capital Management. McKinney convinced QAR to let him open-source Pandas. Later, another QAR employee named Chang Xi helped him in the development process of the core Pandas libraries in 2012. Over time, various versions of Pandas have been released, including the latest Pandas 1.4.1.
What are pandas?
If you’re considering data science as a career, one of the first things you should do is learn about Pandas. Pandas is a library used to create and manipulate structured data in Python. What is meant by structured data? Structured refers to data stored in tables. Tables that contain rows and columns. It’s similar to what you’d see in a spreadsheet or database.
Data scientists, analysts, programmers, engineers, and most tech jobs must structure and format their data. Pandas allow professionals to categorize their data for computers with minimal main memory. Of course, the syntactic and operational combination that Pandas do on data is inspired by libraries and frameworks like PySpark, Dask, Modin, cuDF, Baloo, Dexplo, Table, StaticFrame, and similar examples.
While these libraries are used for different purposes, in most cases, they are suitable for working with big data, while Pandas can work on data that is not so large.
What is the use of Pandas?
Pandas provide an infrastructure for interacting with data, allowing you to refine, transform, and analyze data. Developers can use Pandas for a variety of projects. For example, let’s say you want to explore a dataset stored on your system as a CSV file. Pandas read the data from the CSV file and transferred it to a DataFrame with a tabular structure.
Next, it allows you to do the following on the data:
- Perform statistical calculations on the data and obtain each column’s, median, maximum, or minimum value .Check if column A is correlated with column B.
- How is the data distribution in column C?
- Perform a data cleaning process based on filters applied to rows or columns.
- Visualize data with Matplotlib and draw bars, lines, histograms, bubbles, and more.
- Convert and save the refined data to a CSV file format, database, etc.
Before we get into data modeling or visualization, let’s talk about datasets and what Pandas can do.
What benefits do Pandas provide to developers?
- High speed and better performance in data editing and analysis.
- Ability to load data from different sources.
- Simple handling of missing data in floating point and non-floating point calculations.
- Ability to resize columns so developers can insert or remove objects of higher dimensions in the DataFrame.
- Integrate and integrate data sets.
- Flexibility in shaping the data set and determining the pivot point.
- Provide capabilities for time series.
Why are Pandas the essential tool a data scientist can have?
Pandas library is one of the critical components of data science and can be used in interaction with other libraries. Data in Pandas is often used to feed statistical analysis in SciPy, plotting functions from Matplotlib, and machine learning algorithms in Scikit-learn. Pandas is based on the NumPy package, which means that most of the NumPy constructs are used or replicated in Pandas.
Jupiter notebooks are also an excellent environment to use for data exploration and modeling, although it is possible to use Pandas with other text editors. Jupyter notebooks allow us to execute code in a specific cell instead of an entire file.
The above approach brings considerable time savings when working with large and voluminous data sets that may complicate the transformation process. Also, notebooks provide an easy way to visualize Pandas’ data frames and graphs.
When should we use PANDAS?
If you have no experience in Python coding, you shouldn’t start learning Pandas. Of course, you don’t need to know the most advanced software engineering concepts to work with Pandas, but it is essential to know the basics, like lists, tuples, dictionaries, functions, and iteration loops. Also, due to the many similarities that Pandas have with Nampa, we suggest you consider learning Nampa first.
How to use Pandas?
The first step to working with Pandas is to install it in the Python folder. To do this, we need to use the pip command. On Windows operating system, open a command prompt window, open the python folder and navigate to the folder where python-pip is installed. After finding the desired folder, run the following command:
Pip install pandas
After installing Pandas, you need to import its library into your application. The process of adding the above module is done as follows:
Import pandas as PD
Here, pd is known as an alias for Pandas. Of course, importing a library using a handle is not necessary and is only used to shorten the code when calling a method or property.
Data structures in Pandas
Pandas generally provide two data structures, Series and DataFrame, for data manipulation.
Series
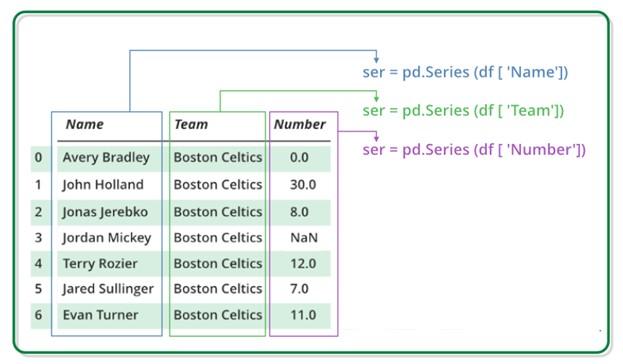
Arrays in Pandas are one-dimensional labeled arrays that hold different types of data, such as integers, strings, floats, Python objects, etc. These tags do not have to be unique but must be hashable. Here, axis labels are called indices.
Objects in Python support both object-based and integer indexing modes and provide developers with a set of methods to perform indexing operations. More specifically, the Pandas series are similar to columns in an Excel sheet. Figure 1 shows an example of a series data set.
How to make a series
In the real world, a Pandas series is created by downloading datasets from storage. This storage can be a SQL database, CSV, or Excel file. Pandas arrays can be made from lists, dictionaries, scalar values, etc. The following code snippet shows how to do this.
import pandas as PD
import NumPy as np
# Creating empty series
be = PD.Series()
print(be)
# simple array
data = np. collection ([‘g,’ ‘e,’ ‘e,’ ‘k,’ ‘s’])
Be = PD.Series(data)
print(be)
The output of the above code is as follows:
Series([], type: float64)
0 g
One e
Two e
3 k
4 s
type: object
DataFrame
Pandas data frame is a 2D data structure of variable size, heterogeneous data with labeled axes (rows and columns). A data frame is a two-dimensional data structure in that the data is aligned in a tabular form with rows and columns. DataFrame consists of three main components, data, rows, and columns. Figure 2 shows an example of DataFrame data.
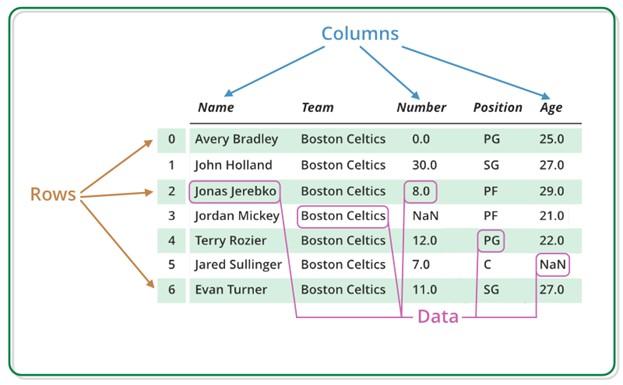
figure 2
To be more precise, DataFrame should be called a more advanced series version because it can hold columns (Figure 3). As you can see, DataFrames and Series are pretty similar, so it is possible to perform many operations on both types.
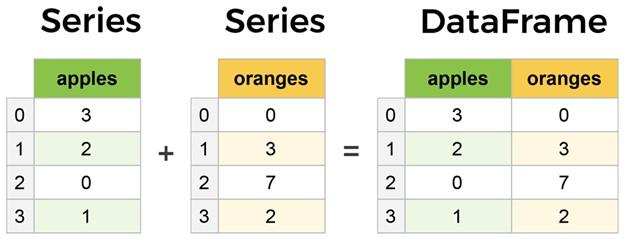
Figure 3
How to build a DataFrame
A data engineer must collect and store data in a data warehouse. Dataframes, like series, is created by downloading data sets from storage media. Further, the data frame can be made using lists, dictionaries, etc. The following code snippet shows how to do this.
import pandas as PD
# Calling DataFrame constructor
df = PD.DataFrame()
print(df)
# list of strings
lst = [‘Geeks,’ ‘For,’ ‘Geeks,’ ‘is,’
‘portal,’ ‘for,’ ‘Geeks’]
# Calling DataFrame constructor on the list
df = PD.DataFrame(list)
print(df)
The output of the above code is as follows:
Empty DataFrame
Columns: []
Index: []
0
0 Geeks
1 For
2 Geeks
Three is
Four portal
5 for
6 Geeks
How should we read the data?
Downloading data from files and transferring them to a data frame is simple. For example, let’s say we want to read data from a CSV file and share it with a data frame. For CSV files, this is simple and can be done with just one line.
df = pd.read_csv(‘purchases.csv’)
The output will be the same as in Figure 4. One thing you should pay attention to about CSV files is that the above files do not have data frame indicators. Therefore, we need to specify the index_col parameter when reading data from CSV files.
df = PD.read_csv(‘purchases.CSV, index_col=0)
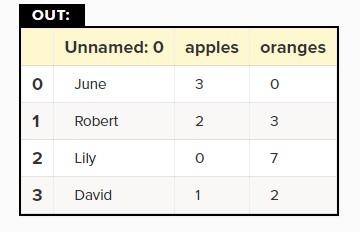
Figure 4
In this case, the information is entered in a more readable and accurate way (Figure 5).
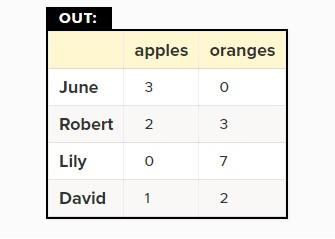
Figure 5
Here we set the index to column zero. Most CSVs do not have an index column, so there is no particular concern.
I am reading data from JSON.
If you have a JSON file, Python can read the information in this file and convert it to a dictionary data type. As a result, it provides a powerful mechanism for working with JSON data.
df = pd.read_json(‘purchases.json’)
The advantage of JSON data is that it does the indexing process in a built-in way, and we don’t need to do anything special in this field. Pandas create a data frame by parsing the JSON structure, but sometimes this process is not done correctly. To solve this problem, use the orient keyword argument.
Read data from an SQL database.
For example, suppose we have an SQLite database. If you have data stored inside a SQL database, you must do extra work. Using a Python library to communicate with the SQL database, send a query to Pandas. To read the information in this database, you must follow the steps below.
First, we need to install pysqlite3. Open a command prompt, navigate to the Python folder, and run the following command:
pip install pysqlite3
If you are using Jupyter Notebook, run the following command in the cell:
!pip install pysqlite3
sqlite3 is used to communicate with a database. For this reason, we first need to establish a connection with the database and then build a data frame using a SELECT query. To communicate with an SQLite database file, we use the following commands:
import sqlite3
con = sqlite3.connect(“database.DB”)
In the hypothetical SQLite database, we have a table called purchases, and our index is in a column called index.
Next, we need to call our dialog with the connection link we created as follows:
Df = PD.read_sql_query(“SELECT * FROM purchases”, con)
Like CSV files, we can use index_col=’index’ to set the index position.
df = df.set_index(‘index’)
indexing in series and data frames is one of the everyday tasks that data science professionals have to do. For this reason, you should increase your knowledge about indexing. We can use set_index on any data frame and any column.
How to convert CSV, JSON, or SQL
After cleaning the data, you are ready to save the data to the desired files. The process of writing data to files is the same as reading them. The process of saving data in files is done in the following ways:
df.to_csv(‘new_purchases.CSV)
df.to_json(‘new_purchases.json’)
df.to_sql(‘new_purchases’, con)
When we store JSON and CSV files, all we need to do when calling the functions is to specify the file name and format to which the information should be written. For SQL, we don’t create a new file but add a new table using the con variable that establishes the connection to the database.
Why do we use Pandas?
Pandas are mainly used for machine learning and data science projects. Still, data scientists also use it because it can be used in conjunction with other data science libraries such as NumPy. Data generated by Pandas are often used as input for plotting functions in Matplotlib, statistical analysis in SciPy, and machine learning algorithms in Scikit-learn.
Developers can use any text editor for Pandas, but Jupyter Notebook is recommended because Jupyter can execute code in a specific cell instead of the entire file. Jupiter provides a simple way to visualize frames, data frames, and graphs in Pandas.
What features do Pandas provide to developers?
Exploratory data analysis is one of the Pandas’ essential features, allowing for comparing numerical data and classifying them. For this purpose, Pandas offers various techniques for data visualization to programmers. Pandas give the ability to filter rows, which enables the process of implementing dialogs on the data to select subsets based on logical conditions.
Index Alignment is another essential feature that Pandas provides to programmers to achieve accurate results. Grouping to perform data aggregation, purification, and analysis is another feature that Pandas provides to programmers. It is essential for data analysis. So it is possible to create custom functions and apply them to groups.
Pandas provide the possibility to reconstruct the data in a Tidy Form. More precisely, it allows you to transform and use opaque data sets into ordered and structured forms in various ways. It also provides Time Series Analysis and advanced and powerful capabilities that allow you to work on data differently.
Finally, the debugging and testing feature allows you to identify problems with Pandas data frames and code.