


Site speed measurement with waterfall tab in gtmetrix
Today, one of the main actions that people take to expand their business is to set up a website to attract the attention of the target audience through this platform. In this regard, they first prepare high-quality such as the hosting required for WordPress and then launch their website by installing a popular content management system such as WordPress. But the thing is that setting up a website alone cannot make you successful. In this way, you should consider various factors and take steps to improve your website conditions, one of the main of which is site speed measurement. Because the faster your website is and the faster its pages load, the more enjoyable the user experience will be. One of the online tools you can use to measure and improve your site speed is Gtmetrix. On this website, and especially on the Waterfall tab, you can get very detailed information about the requests on each page of your website, how they are loaded, and finally the effect it has on the full page load speed. In this article from Fa Host Knowledge Base We decided to examine the Waterfall tab of GT Metrics and the role it plays in measuring your site’s speed. So if you want to learn more about this part of the Gtmetrix website, stay with us until the end of the article.
The topics covered in this article are as follows:
- The role of site speed measurement in improving site performance
- Waterfall tab analysis training in gtmetrix
- Analysis of the Timeline section in the Waterfall tab of GT Metrics
- How to measure site speed using Event Timings
The role of site speed measurement in improving site performance
Speed is one of the most important issues that can directly affect the overall performance of the website. In fact, the higher the speed of your site, the better the user experience and the more positive opinion your website visitors can have. In fact, research has proven that when a website has a suitable speed, users are more encouraged to stay on that website and familiarize themselves with its services, on the other hand, the desire of users to return to the site in the next times is also very high. In addition to this issue, Google also considers site speed as a determining factor and places websites that are faster in a better position. The prevailing belief is that websites that can meet the needs of Internet users in a more appropriate way are more valuable and can take the initial ranks of search results.
All these things eventually cause site speed measurement to become one of the main factors of the site. In this regard, people try to measure the speed of their site by using various online tools and improve their performance in this field. GT Metrics is one of the most important tools that is very popular among people. In this regard, information is displayed in different ways and in different categories, one of which is the Waterfall tab in gtmetrix. In this tab, you can visually see the loading behavior of different pages of your website. In fact, in the waterfall tab of GT Metrics, it is possible to check the loading order of information and details related to requests in a precise and specific manner. By measuring the site speed with gtmetrix and checking the information provided in it, you can optimize the performance of your website in the best possible way.
Tutorial on analyzing the Waterfall tab of JT Metrics
One of the main GT metrics tabs through which you can get valuable information about website performance is the Waterfall tab in GT metrics. Using the information provided in this section, you can identify common patterns and understand in which areas you are performing well and in which areas you need to improve your performance. But the thing that should be mentioned is that analyzing the information in this section in order to measure the speed of the site is not an easy task. Because you are faced with a large amount of graphs and different information, understanding requires having the right background. To better understand this information and measure the site speed with their help, you should first familiarize yourself with the sections and terms used in the Waterfall tab in gtmetrix. In this regard, we will continue to introduce these sections and how to analyze site speed using them.
Generally, the waterfall tab in gtmetrix is divided into 5 main columns and all the information is displayed in these columns. The above columns are:
- URL : file address
- Status : HTTP request status
- Domain : File source
- Size : File size
- Timeline : Time table
Stay with us to examine each of these columns of the waterfall tab in GT Metrics and their role in measuring site speed in a more detailed way.
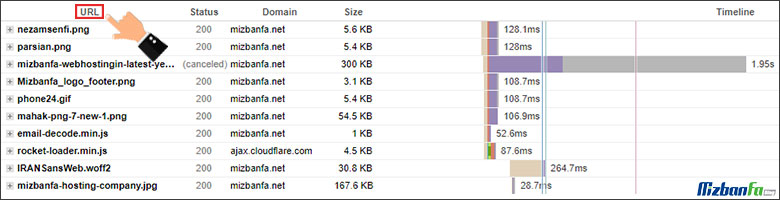
1. URL : In this section, you can see the name of the file or resource that is loaded by the web browser. Maybe when you enter the Waterfall tab in GT Matrix and see the information displayed in this section, you may have the impression that everything is complicated and incomprehensible. But in fact, there is no need to identify each of these links. Knowing that jpg. and png. Indicates a photo or css file. representing different styles or js. It displays JavaScript files. In the initial stage, it is enough to try to measure the speed of the site using the statistics of the Waterfall tab in gtmetrix.
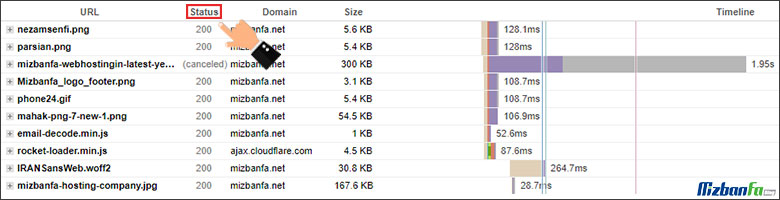
2. Status : This part shows the HTTP response status to the sent request. In fact, according to the status of this section, you can find out whether a response is received from the server side or not after sending a request through the browser. In general, the HTTP response status consists of a status code and a human-understandable message . For example, you may encounter a 404 Not Found message that contains both of the above sections. (404 is the status code and Not Found message.)
HTTP Response Status can be broadly divided into the following categories:
- 1xx : In this case, the request has been successful and the display of this status is more informative and rarely shown in the Status section of the Waterfall tab in gtmetrix.
- 2xx : In this case, the response to the request has been successfully received from the server, and usually this code is shown to users as code 200 in GT Matrix.
- 3xx : In this situation, the server has responded to the sent request. But the noteworthy point is that the response to the request is sent to the browser as a redirect, which is the most famous code of this redirect category 301.
- 4xx : This situation will be visible when the request sent is not answered by the server for some specific reasons, which are usually related to the client. In this case, the desired link and its related information will be displayed in red. Error 404, error 401 and error 403 of the site are considered the main errors of this category.
- 5xx : The links that are specified in the Waterfall tab in GT Metrics, indicate the failed response status from the server side, and this happens because of a server problem. This status is also displayed in red color and 500 site and 503 site error are the most famous errors in this category.
Keep in mind that the purpose of analyzing the information placed in the Waterfall tab in gtmetrix is to measure the speed of the site and improve it. You should remove or modify any requests marked in red from the target page in order to improve your website’s loading server