Test site speed up with Video tab in Gtmetrix
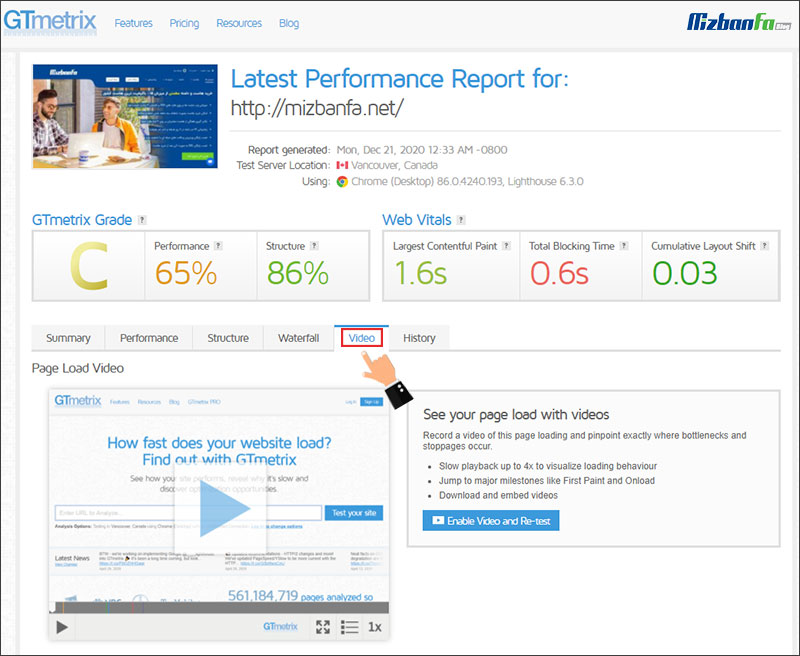
Setting up a professional website can help you grow your business properly. At the beginning, you should buy Iranian quality hosting such as the best hosting for the online store or hosting for WordPress , and then plan to improve the performance of your website in search engines. Analyzing site speed and solving potential problems can play a very important role in improving the performance of your website. This is why people have turned to the GT Metrics website and their site speed analysis through this online tool. One of the unique features of Gtmetrix is that it allows test the speed of the site by imaging the process of loading the desired page. As a result, users can very accurately check the loading speed of their website according to the criteria provided by GTMetrix. In this article from the Fa host knowledge base, we have tried to provide you with a comprehensive and accurate analysis of the Video tab in gtmetrix.
 The topics covered in this article are as follows:
- How to test site uptime in GT Metrics
- Site speed analysis using the Video tab in Gtmetrix
How to test site uptime in GT Metrics
Website speed is one of the main factors that can directly affect the success of a website. For this reason, it is necessary to first get acquainted with the factors that can increase or decrease the speed of the site, and then take steps to improve the site according to them. The GT Metrix website has very detailed criteria for checking the speed of the site, which you can use to easily evaluate the performance of your website, and even use the Video tab in Gtmetrix to take the site crawl test. Kurds.
The GT Matrix video tab allows you to view everything that happens during the full-screen loading process in a single video file . Given that the page load time is in milliseconds, this will help you to better test your site’s uptime. As a result, you can use the various features provided by the video tab in gtmetrix to better analyze the video and gain a better understanding of the various GT Metrics metrics and the role they play in page loading.

Site Speed Analysis with Jiti Metrics Video Tab
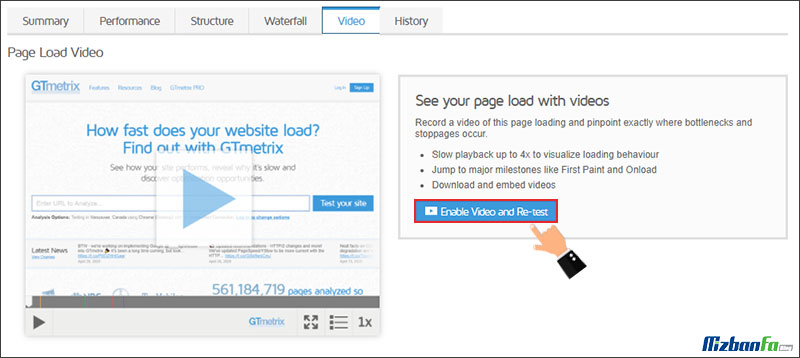
In order to test the site’s uptime using the Video tab in Gtmetrix, you need to familiarize yourself with the sections and criteria provided in this tab. In the following, we will take a closer look at the Video tab and by examining the different sections in it, we will help you to have a better analysis of the performance of your website in terms of speed. When you click on the Video tab in Gtmetrix, you will see a page like the one below. On this page, in order to be able to test the site uplift, you must click the Enable Video and Re-test button. As a result, a speed test in Gtmetrix is taken again from the above screen, during which an accurate image is taken from the time the screen is raised.

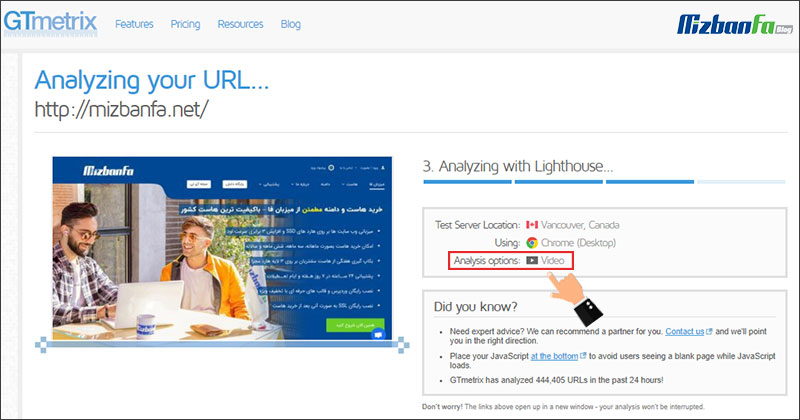
Keep in mind that the speed test that is performed again is accompanied by a screenshot, at the time of completing the site uplift test Analysis Options option video.
In this imaging, you will be shown exactly where the main criteria of GTMetrix speed are located. For example, in X seconds, you have the TTFB factor, and in Y seconds, the ONLOAD criterion occurs. As a result, you can better analyze your web page loading process. You will even notice what parts of the time were spent until the page was fully loaded.

After the pop-up site test with the screenshot is successfully completed, it will be faced with a screen like the one below. On this page you can see various options in the video toolbar at the bottom that can be used when trying to analyze the page speed up.
In the following, we will introduce each of these features and how to use them:
- Video play button: By clicking on this option, you can see the video taken from the time the site was uploaded. This way, you can easily find out which sections load faster and which ones take longer.
- Full-screen video : Selecting this option will make the captured video full screen.
- Explanation of the meaning of the colors of the displayed criteria: As mentioned before, each of the GT Metrics speed criteria is displayed in a specific color in the video. You can click on this option to see a small guide on the side of the page. For example, in the image below, you can see the colored lines on the video play bar, which are marked with numbers 1 and 2. This colored line tells you what happened in what second after analyzing the site. Also, if you want to know exactly what each term means and how it can be improved, read the JT Metrics Terms.


