


Learning how to view the amount of resources consumed by the site in the cPanel host
Website speed and hosting power are the topics that can play an important role in the site’s overall performance and the level of user satisfaction. The speed of a website is directly related to factors such as CPU or RAM. If your website exceeds the CPU and RAM resources allocated to it, the website will still be available to users but with significantly reduced load times. For this reason, checking the number of resources consumed by the site can be one of the issues that website owners should consider. In this article, from the Fa host knowledge base , we have decided to train on how to view the number of resources consumed by the site in the cPanel host and provide you, dear companions, with the
The topics covered in this article are as follows:
- Learning how to view the number of resources consumed by the site with the help of cpanel
- Checking the consumption of site resources in cPanel
Learning how to view the number of resources consumed by the site with the help of cpanel
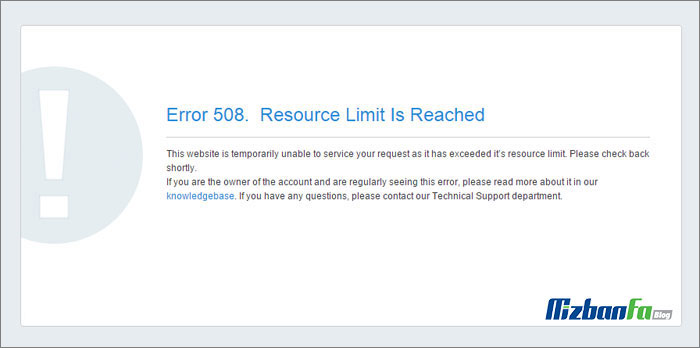
This educational article introduces you to how to view the number of resources consumed by the site in the cPanel host. In shared hosting services, specific resources are considered for each website, which include a certain amount of processor or CPU, memory or RAM, hard disk, and the number of simultaneous processes on that website. Whenever one of the above items, such as processor, RAM, or concurrent requests, are used to the maximum extent, the user’s site will face slow loading and management, as well as a disruption in the functioning of the website, and it may become unavailable in minutes. In this situation, you will see error 508 or Error 508 Resource Limit is Reached.
This can happen instantaneously and at different times. Because the problem of slowness occurs only when the resource consumption reaches the maximum allowed for the service, and there will be no problem at other times. You can view the resources consumed by your service accurately and graphically through your host’s control panel and by using the Resource Usage option. To access this section in order to check the amount of consumed resources, you can follow the following steps:
- First, you need to log in to your cPanel host.
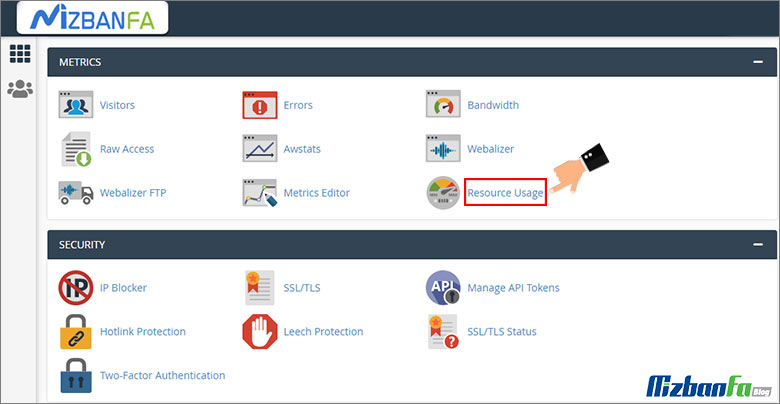
Teaching how to enter the control panel of CPanel host - Then select the Resource Usage option through the Metrics section. (This option may be displayed under CPU and Concurrent Connection Usage in your control panel.)
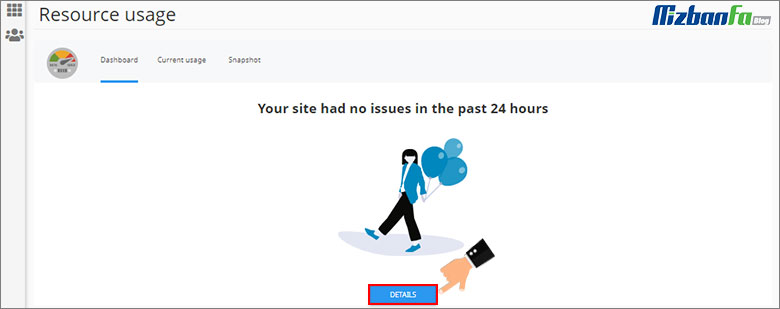
- You can see a summary of relevant information on the resource consumption page. Depending on the usage of your account’s resources, you may encounter one of the following:
- Your site had no issues in the past 24 hours: This means that your site had no issues in the past 24 hours, and no restrictions were applied.
- Your site has been limited within the past 24 hours: If you see this message on your dashboard, you should know that at least one resource limit has been created for your website in the past 24 hours. cPanel will show you more information about which resource caused such a restriction.
- Your site might hit resource limits soon: This warning is displayed when there is a possibility that your account will face resource limits shortly. cPanel shows the necessary information about which resources are at risk of restriction so that you can correct them.
- To check the details about the number of resources consumed in your account, you must click on “Details” on the Resource Usage page. This way, the details of the consumption of consumed resources, along with the graphic diagram, will be opened for you.
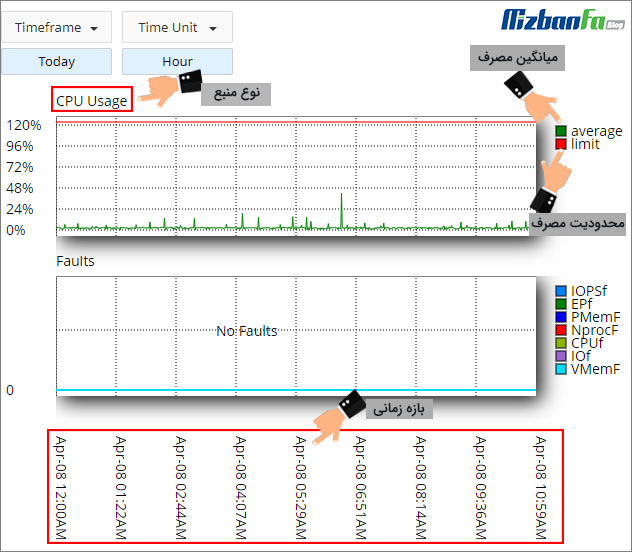
- At this stage, the graphic diagram of your site consumption will be displayed with full details.
By default, cPanel displays information about the amount of resource consumption for the current day. To change the displayed time interval, you can select the ” Timeframe ” option and apply your desired time range. Using the ” Time Unit , you can also set the distance between the data points displayed in the graph.
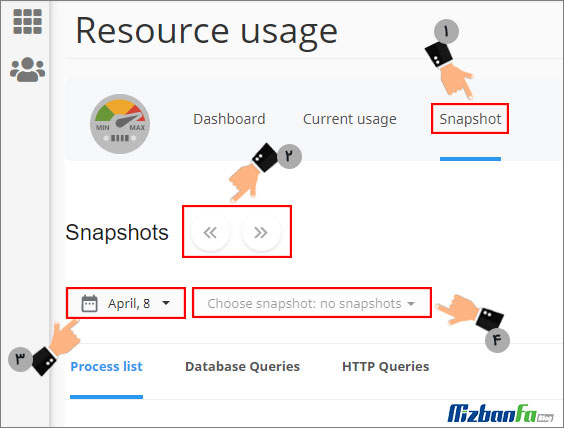
- By clicking on Snapshots, you can see snapshots of the amount of resources consumed by your website. Depending on which consumption mode your website is in, a list of processes as well as a list of database data may be displayed. You can check the information of this section as follows:
- With the help of arrow buttons, you can view the images in order.
- The calendar on the side of the page helps you to choose a specific date.
- You can choose a specific time using the snapshot box list.
In the following, the options available in the Current Usage section, which is the main section related to information on the number of consumed resources, are presented along with the necessary explanations to understand the meaning of each of these options. So stay with us.
Checking the consumption of site resources in cPanel
The information that you can see on the Current Usage page of cPanel regarding the number of resources consumed by your website includes the following:
- CPU Usage: This section is related to the maximum consumption of CPU resources allocated to each user account. Excessive consumption of CPU resources can disrupt and slow down the server, which is very important and must be considered.
- Input/output Usage: The IO limit controls the throughput of users, which is calculated in KB/s. When these resources are exceeded, operations will be slow or stopped because IO is one of the scarce resources in shared hosting.
- Entry Processes: This section is for controlling entry processes. The best way to understand this limitation is for some web scripts that can be executed by website visitors simultaneously. This restriction is also important because it prevents the Apache web server from not working properly.
- Processes: This section limits the number of site processes so that when this number reaches the maximum defined amount, a new process will not be applicable until one of the processes is completed. This can prevent DDoS attacks.
- Faults: This section shows the number of incorrect Entry Processes and virtual RAM recorded by the system.
Users who are facing the problem of slow speed and malfunction of their site can check the status of their consumed resources from this section, and if they have the maximum consumption of current resources, they can hosting to higher plans with more usable resources. Upgrade to solve their problem