What is an infographic?
What is an infographic?
In the answer to what is an infographic, it is interesting to know that infographic is a combination of two words, information and graphics. Infographics are a collection of texts, images, graphic elements, etc., that depict an overview of your desired topic and give the audience the ability to understand information at a glance. In principle, one tries to use attractive and eye-catching images and beautiful colors in making infographics. Nowadays, with the increasing growth of the web world and the increasing trend of content production, infographics are considered a valuable and distinctive tool to overtake competitors and communicate visually with the audience.
You must be asking what is an infographic? In very simple terms, it can be said that infographics include graphs, diagrams or images that are presented visually and the purpose of making them is to convey information quickly and attractively to the audience. It is interesting to know that the speed of transferring data through an infographic is much higher than a simple text, and since the infographic is visual, it is more attractive to the audience. Basically, it is suggested to use infographics in articles because it increases the power of understanding. Infographics are the best type of structure for storytelling, social networks, and short tutorials.
In fact, infographics will increase the attractiveness of the content, better understanding and increase the speed of information transfer. On the other hand, the possibility of sharing infographics by contacts can be effective in the growth of your business.
What is the use of infographics?
As mentioned before, there are different purposes for making infographics, but basically, infographics are used to transfer information completely and quickly, so that the audience can find out a huge amount of information in a fraction of the time. Infographics have various uses, including:
To better guide and educate students in schools with the aim of better learning
Share work history and records
Branding and audience attraction
Training and increasing sales in social networks
Publishing on the web to attract users
Increasing the speed of transferring information to the audience
And…
How to make an infographic?
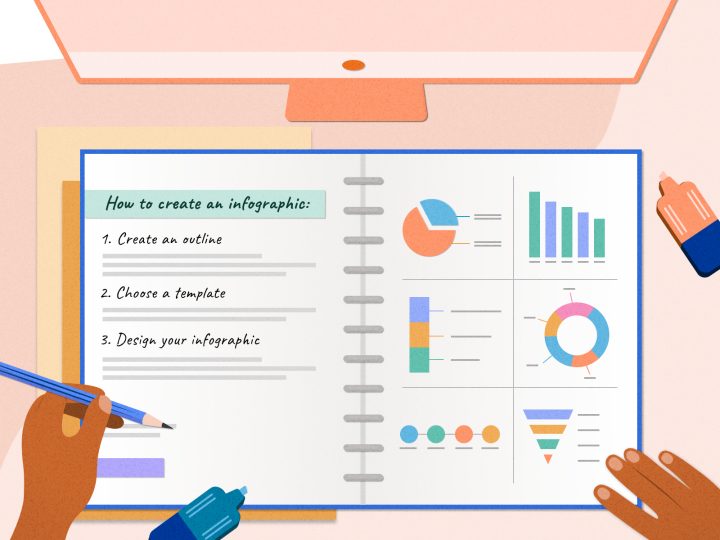
After the explanations given in relation to what is an infographic, it is necessary to know that in order to create an infographic, you need some quality data in the first step, then you need to analyze the process of transferring data to the audience and choose a method of how to display this data in a visual form. Place them next to each other, which in addition to the attractive appearance, is loaded and useful. On the other hand, you should maneuver the content so that important and key information is prominent, for example, similarities, differences, advantages, advantages, important data, etc. can be easily recognized in your visual content. Finally, you should use a graphic tool to design your data visually.
There are various tools and software for creating infographics, including Photoshop and Adobe Illustrator. Of course, various software such as pixart program are also considered for mobile phones, which can design relatively simple images.
In the image below, you can see a simple example of an infographic that compares the image of a web page on a desktop and a mobile phone and other devices.
What are the types of infographics?
You must be asking how to make an infographic? How to put the information together and what structure to use to display the data? A very important point that you should consider before creating an infographic is which type of infographic is more suitable for you and can be more effective? Besides, it is possible to use the combination of different types of infographics to increase the attractiveness and effectiveness.
types of infographics are:
- Visual infographics
- List infographic
- Map infographic
- Compare information
- flowchart
- Resume infographic
- Gifographic or animated infographics
- And…
1- Visual infographic
This model of infographics is very practical and popular and we often see it in social networks and statistics. Because they are very attractive to the audience and the probability of sharing this infographic model is very high.
2- List infographic
If your content includes a series of steps, you should use this style to make your infographic step by step and list. In this type of infographic, the various stages of doing a task are depicted step by step with the help of numbers, symbols or even in a staircase. This infographic template is great for displaying educational items and multi-step activities.
3- Map infographic
One of the types of infographics that is used in drawing geographic locations or displaying spatial information. This type of infographic is mainly used in the design of travel maps.
4- Comparing information
Another type of infographics is used to compare information. In this way, the differences and similarities, advantages or disadvantages of the desired items can be displayed simply and attractively.
5- Flowchart
A flowchart is a type of infographic that shows the steps of doing a task or reaching a certain result. In fact, a path of activities are put together to reach the final achievement. For example, the steps of installing Photoshop on a computer can be drawn as houses built on a road. Each of these houses is one of the stages of installation. For example, the first house on the road is to download the Photoshop installation file, the second house on the road is to extract and start installation, etc. The house is located at the end of the road and Photoshop is fully installed! In fact, you have to go through this road like a game of snakes and ladders.
6- resume infographic
Nowadays, infographics are also used to present resumes, so you can present your resume, background, abilities, skills, and personal information in a concise, useful, and eye-catching way. This model of infographics is very useful for collecting employee information in organizations.
7- Gifographic or moving infographics
So far, you’ve seen the appeal of infographics and their effectiveness, but if you want to have content beyond infographics with many times more impact, try Gifographics! It means infographic-style images that are animated and can attract the audience. You must be asking if they are different from the video!! The cost and time of making gifographics is much lower than animations.
Important points of making infographics
Well, now that you know what an infographic is and you are familiar with the types of infographics, it is better to familiarize yourself with the steps of making them. Basically, making infographics seems a bit difficult for people who do not have much expertise in the field of design.
First, you should complete the following checklist for yourself:
- What is the purpose of the infographic you are making? Do you decide what will happen after seeing the infographic or where to direct the audience?
- Who is your infographic useful for? (Thinking about the audience of this infographic)
- Collect useful and of course very practical information to present an infographic.
- Choose your favorite color scheme. It is better to use happy and attractive colors and consider 3 colors as the main colors. (Specify what color each element should be, for example, titles are dark)
-
Manage white spaces within infographics. It is better to use the space as much as possible and balance it. Extreme imagery should also be avoided.
- Pay attention to the standard sizes of infographics. Your infographic should be designed in such a way that, firstly, it does not lose quality on different devices, and secondly, it can be used on mobile and desktop. The standard size depends on the platform you want to publish, for example, the size of an infographic made for the Instagram social network, most of whose users are mobile, is completely different from an infographic made for website articles.
- Create a powerful structure for your infographic. Every infographic needs an introduction or beginning, guide, main part and end, just like a quick and summary tutorial, you need to prepare the mind of the audience with the introduction, then go to the main content and finally summarize everything with an attractive ending.
- If you used a specific source, declare it at the end of the infographic.
- Providing details and tips is one of the main pillars in creating infographics that can lead to content sharing by contacts.
- You cannot fit all the information in the infographic because it will make the image crowded, but it is better to mention the most key and important points.
Very important point: wrong choice of infographic colors can destroy all your hard work. Because the colors attract the attention of the audience in the first few seconds, and if you cannot use the right and attractive color scheme, you will lose the chance to be seen and read the infographic.
Well, for this purpose, consider the following points:
Use the color spectrum circle.
Color contrasts make infographics attractive.
Use your branding colors in creating infographics.
Pay attention to the white spaces around and inside the image so that the balance in the image is respected.
Turn the audience’s eye with the help of colors and elements in the image so that the focus and gaze of the audience is not directed to only one part of the infographic.
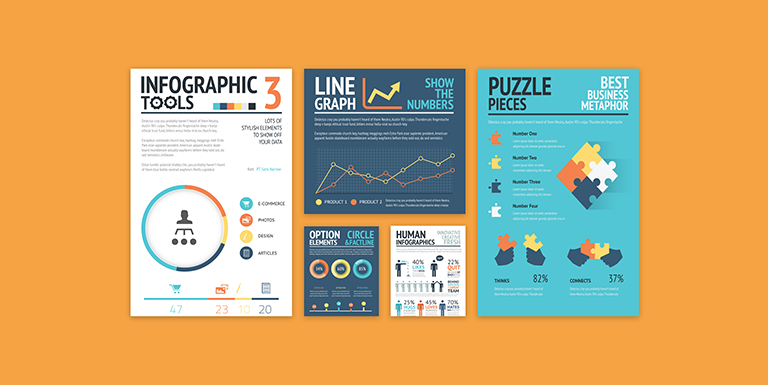
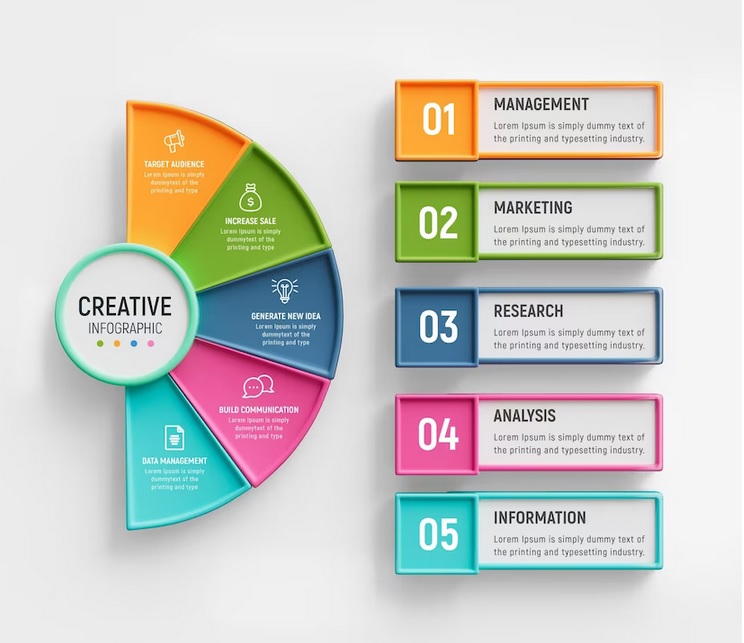
An example of an infographic: