


The Best Tools For Identifying Application Performance Problems In Visual Studio
Having Problems With The Performance Of Your Applications? Maybe It’s Time To Take Advantage Of The Profiling Tools That Visual Studio Provides.
If you are a developer using Visual Studio, you should note that some excellent profiling tools come with Visual Studio that is available to developers.
These tools help you identify problems quickly and provide a detailed report on the program’s performance and modules.
Visual Studio is Microsoft’s most powerful integrated development environment (IDE) for the Windows operating system. Visual Studio is famous for its powerful features and ability to support several well-known programming languages. Undoubtedly, Visual Studio is a great help to developers when writing desktop programs, web applications, and even web services.
One of the most valuable features of this IDE is its variety of profiling tools. These tools help detect various performance issues in your application, regardless of what type of application you have. This article will find the most common Visual Studio profiling tools.
First, take a look at profiling tools.
Profiling tools give you a comprehensive view of application performance from another angle to ensure that your applications are more efficient and perform better than other applications on the market. Unfortunately, most developers do not understand the need to complete this diagnostic process.
Before launching an application, debugging processes and performance benchmarks are performed to ensure that the application runs at peak performance. Monitoring the program’s behavior comes next to ensure it compiles and runs well.
Some developers want to innovate and learn more about what applications they offer. These developers often go deeper into the diagnostics process, where profiling comes in.
Profiling is about measuring the performance of application data during execution.
We collect this performance data and analyze it using various metrics. For example, your application runs smoothly and works as expected until suddenly; it starts to fail. Using profiling tools, you’ll find insights and reports on application performance, discover the root cause of a problem, and come up with solutions to help your application run better, as fast as, or even more quickly than, your competition.
Visual Studio’s top profiling tools
As mentioned earlier, there is no single metric for performance profiling. However, you can use many tools to measure your application’s performance. To help Iranian developers, here is a list of Visual Studio profiling tools that you can use.
Diagnostic Tools
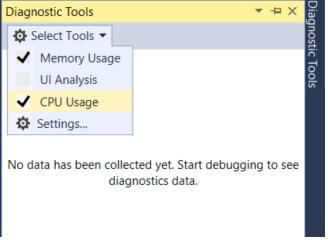
If you don’t know about it, you should know that Visual Studio has many built-in profiling tools. You can use them during a debugging session. All you have to do is check them in the Diagnostic Tools window. Go to Debug -> Windows -> Show Diagnostic Tools. If you prefer shortcuts, press Ctrl + Alt + F2.
PerfTips
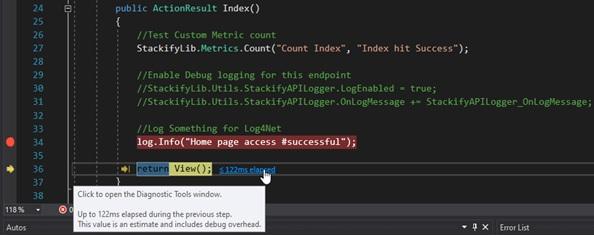
Most performance profiling tools come with technical terms that are familiar names. PerfTips also has this feature. PerfTips provides programmers with tooltips, performance information, and further helpful hints for developers. PerfTips displays information in the code editor window at the end of the code you’ve written, showing how long the program took to run at the last breakpoint you defined.
PerfTip is a link that gives you access to the Diagnostic Tools window to view PerfTip history.
Diagnostic Tool and PerfTip provide valuable tools for diagnosing performance problems while debugging an application. Fortunately, there is an option to turn detections on or off.
Memory Usage
Without a doubt, memory usage is valuable for performance profiling and is a core component of Visual Studio‘s profiling tools. This technique can be implemented on .NET Core, native scenarios, different application types, and mixed-mode applications. Among the features of the above method, the following should be mentioned:
- Memory leak detection
- Code paths
- Imaging from memory
- Analysis using memory
- Checking the amount of processor usage
CPU Usage is another staple on Visual Studio‘s list of performance profiling tools. Why? Because challenges related to CPU utilization are the primary concern of development teams. This Visual Studio tool is available to programmers to check CPU usage accurately.
How to use the CPU tool is simple and not particularly complicated. You can place this tool in an open Visual Studio project, an installed MS Store application, or a running application or process. This is not all. You can even run this Visual Studio profiling tool with or without debugging.
Events viewer
Event Viewer is a new tool developed for Visual Studio. What is he doing? It displays program activity through module calls, loading, thread start, and system configuration. It also reviews ETW and NetRace-based events. Its main features are as follows:
- Collect data on each event
- Additional features for each selected event
- Ability to display up to 20,000 events simultaneously
- The event viewer closely monitors ETW and NetRace-based events and provides detailed reporting.
NET Async
- .NET Async tool. This tool amazingly organizes asynchronous events in chronological order and displays any tasks. Enables developers to analyze the performance of asynchronous .NET code in their applications.
- .NET Async tool. It’s relatively new compared to other examples provided for Visual Studio, but it’s potentially beneficial. Inspecting and asynchronous monitoring code give programmers more visualization when problems start.
- With Asynchronous .NET tools. When you encounter problems, you can identify issues quickly through the visualization capabilities it provides.
NET Perf Counters.
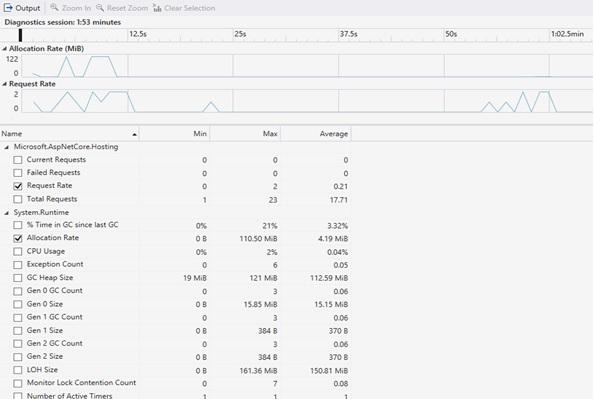
Another new tool added to Visual Studio Tools is the .NET Perf Counter tool. Is. This performance profiling tool allows you to view .NET visual counters in Visual Studio’s profiler, which significantly aids early visualization of investigations when performance issues occur.
As you can see, it provides a detailed report that shows the minimum, maximum and average value of the counter in the time range of your choice. To be more precise, it offers a detailed report related to the counter’s minimum, maximum, and average in the time range of your choice. The main features of the tool are:
- Collect data.
- Displays live values of .NET counters.
- It allows developers to display multiple counters at once by simply checking the box next to the counter name.
- To use the .NET Perf Counter tool. , you need at least Visual Studio 2019 version 16.7, available on a Windows platform with .NET Core.
Checking code performance with Retrace
Apart from Visual Studio tools, there are other powerful profiling tools available to developers that they can use for improvement. When it comes to performance profiling, Stackify Retrace is a powerful option.
The above tool should be described as more than an analytical mechanism that accurately helps developers identify performance bottlenecks in their applications and get centralized reporting, error tracking, and real-time monitoring.
The above tool has everything you need if you’re looking for a code indexer. The device is super lightweight and user-friendly and helps developers improve their code.