


Introduction to Data Studio
Data visualization using visual and graphic tools such as charts, infographics, and even animation is a solution to understand the relationships between data and business better and make better decisions in various business fields, including marketing. Also, data display tools usually have analytical features and reporting tools simultaneously. Currently, multiple platforms are available for displaying and analyzing data, one of which is Data Studio. In this article, we introduce some of these platforms and learn about the essential points of Data Studio training.

Standard tools for displaying and analyzing data for marketers
The purposes of communicating data and creating analytical reports in business are to help generate new ideas, review current business trends, monitor daily business data, and make decisions for strategy and techniques. Also, marketers can use these tools to check the results of advertising campaigns and any action in the marketing field.
There are many powerful and familiar tools in this field, and we will get to know some of them below:
- Microsoft Power BI Platform allows marketers to create and customize dashboards, reports, and charts. The advantage of this platform is that you can use it to develop models based on machine learning.
- SAP BusinessObjects platform: This platform has a set of tools for analyzing and displaying data. It also has the advantage of integrating programs such as Excel and other Microsoft Office products.
- Sisense Platform: Business data visualization, data analysis, an easy user interface with features such as drag and drop, and an interactive dashboard are some of the features of this platform.
- Thoughtspot platform: Thoughtspot is an analytics platform with an artificial intelligence system called SpotIQ that helps marketers achieve their goals.
- Qlik Platform: Looking for a cloud platform, or do you prefer to deploy the platform on-premises? Qlik offers both possibilities and has many charting tools.
- Google DataStudio Platform: DataStudio is a free data analysis and visualization tool that can be integrated with many other Google tools. Also, Data Studio is easy to learn, and you can learn it quickly.
How does DataStudio work?
DataStudio is a platform for automatically receiving data from other media and displaying them in charts, tables, and other visual data visualization facilities. The services of this platform can be traced in 4 sections: integration or integration, conversion, data display, and report generation. Let’s review these things together for a better understanding.
Data integration with DataStudio
One of the stages of Data Studio training is learning the integration capabilities of this platform. Because this platform can connect to many other venues to receive data from them and display them in visual formats. It is possible to integrate DataStudio with these platforms:
- Google Analytics
- Google Ads platform
- Google search console
- Google sheet
- Google My Business tool
- YouTube Analytics
- Bing Ads platform
- Facebook Ads platform
- The MailChimp platform
- The HubSpot platform
- Ahrefs platform
- SEMrush platform
- Shopify platform
Data conversion
The second important feature of Data Studio is the ability to convert data. At this stage, this platform uses its processors to convert raw data into more meaningful data that can be used and reviewed. One of the advantages of this feature is the possibility of creating another feature known as the Explorer option in Data Studio. This option facilitates a journey in the more advanced features of this platform and is still in the beta version stage. For example, it is possible to use new dimensions, mathematical functions, arithmetic operators, and custom formulas in Data Studio Explorer for marketers.
Features of data visualization
In this section, Data Studio displays information in the form of charts, tables, shapes, etc.; the result is the creation of reports that marketers can use to review their actions or current conditions and make decisions for the future.
Ability to share data and reports
After learning Data Studio and creating a visual representation of business data using various tools, you can share the completed report with other platform users, including business managers or members of work teams.
Data Studio training tips
Data is the most crucial asset in digital businesses. However, the business data is so much that humans can use this data alone without using data display and analysis platforms. Google’s Data Studio is one of the most powerful tools for creating dashboards and reports that help marketers and managers analyze data and make better decisions. But how should we use this platform? In the following, we review some of the essential steps and tips of Data Studio training together.

Training to access Data Studio
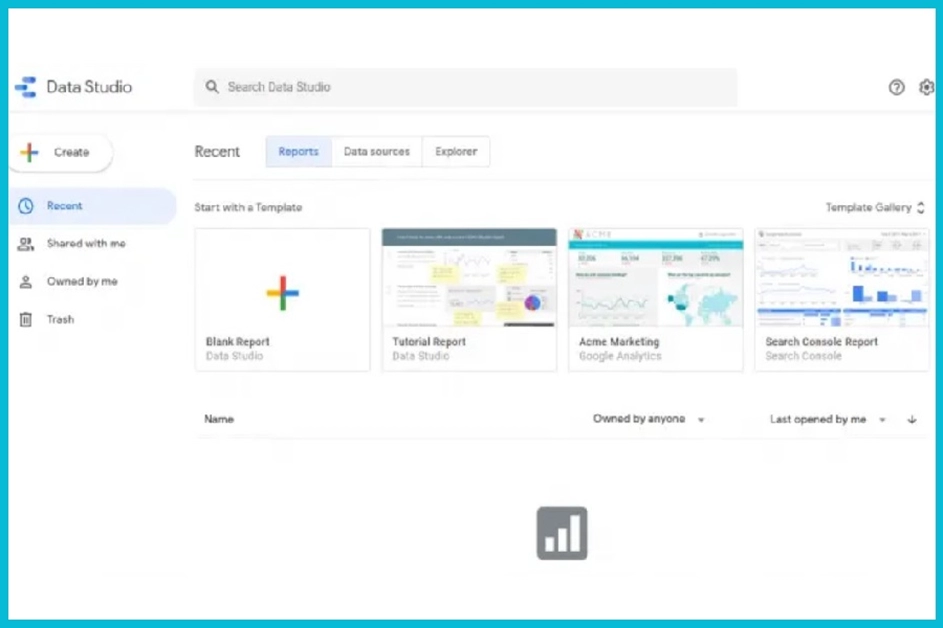
You must create a Google account to start working with Google Data Studio. You can easily open the Data Studio website and view its various sections using this account. For example, after entering this site, you can see the recent reports you have created or reviewed in the left menu. The top menu also includes search, data sources, files, etc.
Adding data to DataStudio
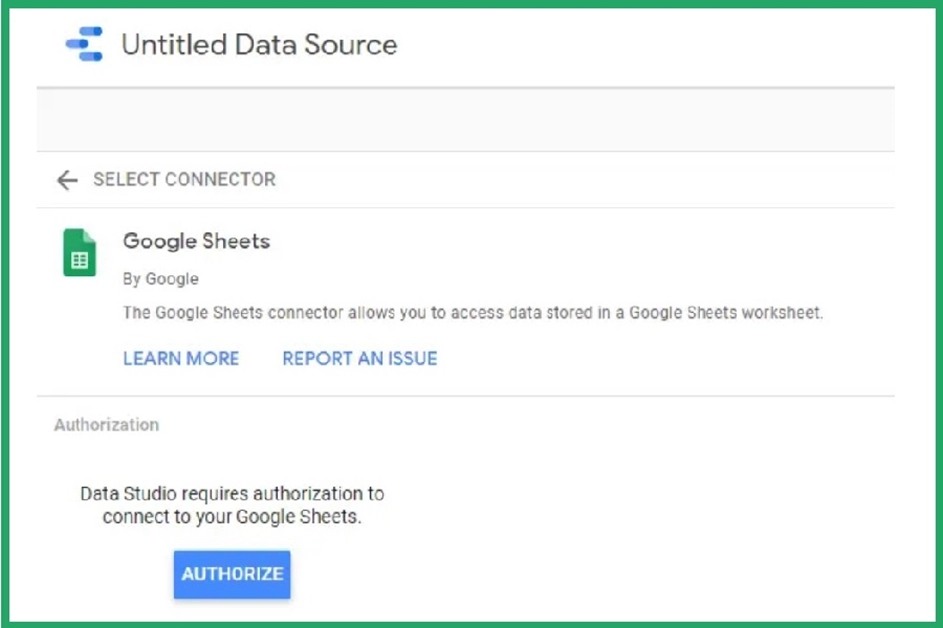
To create a data-driven report, you must know how to add data to the platform. To do this, click on the Create option and then the Data Source option. On the new page, you must select the media through which you will transfer data to DataStudio. For example, you might choose Google Sheets or other platforms. At this time, Datastudio will be connected to your Google account, and you can introduce site pages.
Training to create reports in Data Studio
By clicking the Create button, you can enter the report section. In the next step, you should choose one of the types of templates to create a report from the gallery section. The next step is to select the source. This is no longer necessary if you have gone through the previous stage of adding data to Data Studio. Otherwise, you can do this on this new page. So a page will open for you where you can choose one of the report models such as graphics, shapes, and text. It is also possible for you to customize and customize these templates.

The right column of the screen offers some settings for customization and merges and merges. The menu at the top of the page also has other options, such as adding a chart. Other options in this section include theme and layout options. You can also edit and change the report’s name using the menu at the top of the page. After the necessary settings, you can download the report in PDF format or share it with other users or work team members.

How to use the Explorer option
The Explorer tool in DataStudio is in the experimental stage (beta version). For this reason, this tool has not yet provided all its capabilities. However, this option will help you learn Data Studio and basic experiments, how to work with and analyze data. For example, Explorer enables you to analyze data using more advanced methods. Using this option is not mandatory as a step; However, using it may help you gain a deeper understanding of the data and make better decisions.
To use these features, click on the Explorer option after the Create option on the site’s main page. You must select and add one or more data sources on the new page. At the same time, chart options such as dimensions and models are displayed. Also, this section can filter based on different criteria. Finally, the results are displayed. Therefore, you can add the created chart to an existing or new report. When you click on the Share option, options for sharing will be displayed. As we said earlier, the advantage of Explorer is the ability to create different reports by creating new charts. It is also possible to combine data in this section.
Data Studio is easy to learn.
One of the advantages of working with DataStudio is that this platform, despite its many advantages and features, has an easy user interface and is not very complicated to work with. In this article, we learned how to work with this platform in areas such as accessing the platform, adding data sources, creating settings, creating reports, and sharing and downloading them. Using these training tips, marketers can easily create accounts for data-driven marketing and make the best decisions for their strategy based on these reports.