


How To Work With WordPress Debugging And How To Activate WordPress Debugging
Almost no content management system works correctly for all users with any server and operating system and is free of defects because the uploading of a site depends on many factors, including hardware and software.
Installed on it, it returns. In WordPress, we face the same case, which causes problems for the site for various reasons, such as changes in PHP, activation/deactivation of extensions, etc.
Therefore, there should be a tool for troubleshooting WordPress so that we can fix these problems whenever we encounter an error. It is where the WordPress debug mode was created, and with a tool in the heart of WordPress, you can quickly solve WordPress problems by activating it.
This tutorial from Hostfa’s knowledge base will introduce WordPress debugging and how to activate WordPress debugging; with the help of this tutorial, you can use the WordPress debug tool and find and fix the existing problems on your site. Previously, I introduced a plugin for troubleshooting WordPress and solving the problem of slow speed in WordPress, which is not unrelated to this WordPress debugger. So, if you are looking to fix WordPress errors using wp_debug, stay tuned to the end of this article.
What is WordPress debug mode?
Most of the users who are developing and making changes in the coding of WordPress plugins and templates are unaware of the WordPress debugging tool, and because of this, they will not see the errors that may not appear on the site. But the same mistakes that do not affect the site’s appearance cause the place to be slow, and if the WordPress debug mode is active, you can easily find out about these problems and write the codes optimally in WordPress.
WordPress debug or wp_debug is the best tool for troubleshooting WordPress and fixing site problems. Using this tool, you can find and select the source that causes the error.
WP_DEBUG WordPress is a Boolean constant defined in the wp-config.php file, and by using this function, you can see the errors on the site. This function can follow two values of true and false, which are related to being active or inactive, respectively. If the value is actual, WordPress debugging is enabled, and you can check WordPress errors. But if its value is false, no error will be displayed. But in all cases, the errors shown are not errors; in some cases, they are just recommendations you are told to check.
How to enable WordPress debugging and fix WordPress errors
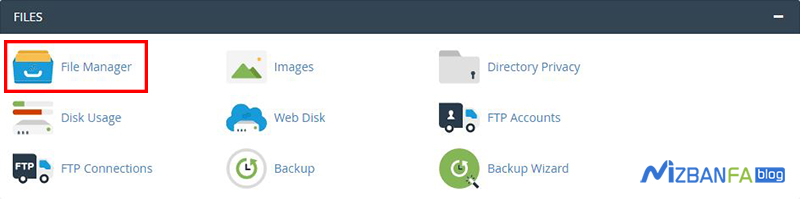
To activate WP_DEBUG in WordPress, you must first enter your host and click on the File Manager option to be directed to the file management page on the host and then go to public_html.
Now that you have entered the WordPress installation in public_html, you should look for the wp-config.php file in this path. After finding the file, right-click on it and select EDIT to open the file editing page. Inside the codes of this file, use the combination keys CTRL + F. WP_DEBUG for
If no results are found by searching for the term WP_DEBUG, there is no code related to enabling debugging in WordPress, and you have to add this code manually. So, add the following code just before the line /* That’s all; stop editing! */ put and save the file. Happy blogging.
define( 'WP_DEBUG', true );
As I said above, if you pay attention, the actual value is set for WordPress to debug in this function, which means that WordPress debug mode is active. If this value is set to false instead of true, WordPress debug mode will be disabled, and no error will be displayed on the site. So, after activating the WordPress debugger, try to fix the WordPress errors, and after finishing the error correction, be sure to change the value of true to false.
WordPress debugging enabled or disabled?
Since the codes are always displayed as errors or recommendations when the WordPress debugger is active, so if there are no errors or notes, no error message will be displayed on the page. But sometimes, it happens that due to the software updates on the server and the changes that are applied, it may affect the WordPress plugin or template and cause WordPress errors to be displayed on the top of the site, which will cause distrust for users. So always use the WordPress debug mode only when making changes to the site’s coding and WordPress development. After the work is done, you can disable WordPress debugging.
Disable WordPress debug error display
To be heard or not to be displayed. One of the functions that the WordPress debugger provides is that by using another function that is considered a subset of the same WordPress debugger and named WP_DEBUG_DISPLAY, you can choose the errors related to activating the WordPress debugger as you wish, which will be displayed. For this purpose, you should put this function right after the line where you started the WordPress debug mode. Please note that by default, this mode is active, and errors are displayed, but to disable the display of WordPress errors in WP_DEBUG_DISPLAY, you must put the following code after the WordPress debug line.
define('WP_DEBUG_DISPLAY', false);
Create a WordPress debug error log with WP_DEBUG_LOG
Another function of the WordPress debugging sub-set called WP_DEBUG_LOG has been created. Using this function, you can save the WordPress debugging errors in a log file. Every time an error occurs on the site, these errors, and their routing, are recorded in this file. The file has been saved, and you can check the errors in this film based on the period in which the exact date and time of the error are recorded for each mistake, and you can know which file is related to the problem of the error occurring on the site. To activate the WordPress debug log, you must put the following function after the code fragment related to the WordPress debug activation.
define('WP_DEBUG_LOG', true);
As you can see, the value is selected in this piece of code, and in this case, a file named debug.log is created inside the wp-content folder of your host whenever an error occurs in WordPress, based on the date and time of the error. The line is saved from this file, which you can check to fix WordPress errors. If we want to use all the above three functions activated in WordPress so that the WordPress debugger is started, the errors are not shown in the user section of the site, and the errors are saved in a log file, the codes must be combined. Use below.
// Turn debugging on
define('WP_DEBUG', true);

// Tell WordPress to log everything to /wp-content/debug.log
define('WP_DEBUG_LOG', true);

// Turn off the display of error messages on your site
define('WP_DEBUG_DISPLAY', false);