


What Is The Tom Demark Index And What Is Its Application In Analysis?
Technical Analysis Indicators Are A Beacon For Traders Who Intend To Find The Best Entry And Exit Points In The Financial Markets Based On Price Movements And Charts.
Oscillators are technical indicators determining the overbought and oversold points for entering and exiting the market by fluctuating in a specific interval. Tom Dimark Oscillators are among the most used technical analysis indicators.
Often a person or group specializing in technical analysis invents indicators and oscillators. One of the prominent and legendary market analysts is Thomas DeMark, who has contributed significantly to the more profound evaluation of market trends by creating efficient indicators.
For some of these indicators in market analysis, platforms such as TradingView (TradingView) need to pay a fee, But others are free for small traders.
This article will introduce you to two examples of Tom Demark’s popular and widely used indicators: “The Dimarker Indicator” and “Sequential Indicator.” By reading this article, you will get an overview of how to calculate these indicators and signal from them, in addition to setting the best points to enter and exit the market with the help of Tom DeMark’s hands.
Getting to know Dimark indicators
Prominent analyst Thomas Demark is the creator of TD indicators, oscillators for more profound market trends assessment. Tom DeMark Indicators, often abbreviated as “TD,” are tools in technical analysis that compare the most recent price floor or ceiling to previous period floors and ceilings to gauge the level of demand for the underlying asset. DDo This comparison aims to evaluate the market trend and find the best points to enter or exit the market.
Tom Demark Oscillators help traders identify the best time to buy or sell an asset and capitalize on possible price trends shortly. It should be noted that an oscillator or “oscillator” is a type of tool (Indicator) in technical analysis that oscillates between two specific ranges and is usually used to determine overbought and oversold levels. Dimark oscillators are included in the so-called “Leading” indicators category and predict market possibilities shortly.
Indicator to combine with other tools
The oscillators of Tom Demark are very similar in appearance to other well-known oscillators in the market, such as the oscillator relative strength index(RSI). However, unlike the Relative Strength Index, Dmark Oscillators focus on previous periods’ highs and lows instead of closing prices. These indicators are often combined with other tools and are generally used to determine price reversal points, identify market tops and bottoms, and assess risk levels.
Two essential and widely used indicators of Tom Demark, Demarker and Sequential (sequence of numbers), are used in trading platforms such as TradingView and MetaTrader. MetaTrader offers the DeMarker Indicator by default, But the Dmark sequence indicator must be entered manually. Also, suppose you don’t find Dmark indicators in the public library of Tradingview. In that case, you can find them in the users’ Community Script libraries by searching for the desired indicator name in the related window.
Introducing the Dimark Indicator
The DiMarker Indicator is one of the powerful indicators designed by Tom DiMark and is available on most trading platforms. Dimarker is an oscillator that oscillates between 0 and 1 and shows oversold and overbought areas. It should be mentioned that this interval is sometimes shown with 100 and -100, that both models work on the same basis.
The values of this oscillator, by comparing the current’s maximum and minimum prices in the time frame, are obtained by the maximum and minimum prices in the previous timeframe. With this comparison, the Dimarker indicator tries to evaluate the general direction of the market and its bullish and bearish sentiments. Also, in the meantime, the conditions of overbuying and overselling are determined, along with the possibility of weakening and the trend’s return.
Dimark Indicator; An accurate tool for traders
Compared to other oscillators, Daymarker generates fewer false signals, and many traders use it to identify possible price path changes to enter or exit the market. Traders can use the Dimarker indicator to determine when to enter the market or buy and sell an asset. The Dimarker Indicator is also used to determine the peaks and valleys of the market. It can help the trader evaluate the market fluctuations and their risk level.
However, we must not forget that the possibility of error and incorrect reading of any technical indicator is not zero. For example, the Dmarker may reach the value of 0.75, and the trader will sell his asset by interpreting overbought and assuming the possibility of a price drop. In this case, if other indicators are not used to confirm the signal, we may face a situation where the selling pressure is still high, and before the price falls, the darker reaches the reading of 0.9.
Overall, it can be said that Dimarker, like other technical indicators, alone cannot be enough to evaluate the market. The trader should use this Indicator as a complete strategy along with several other indicators, such as Fibonacci levels and Bollinger bands.
How to calculate the Dimarker indicator
If the high price for the current period is greater than the high price for the previous period, the DeMax variable is obtained from the difference between these two prices. The DeMin variable also considers the difference between two low prices. In other words, if H is the high price and L is the low price of the period:
- The value of DeMax is calculated if H of the current period (candle) is more significant than H of the previous period; Otherwise, the DeMax value is assumed to be zero:
- On the other hand, the value of DeMin is calculated if L of the current period (candle) is lower than L of the previous period; Otherwise, the DeMin value is assumed to be zero:
- Finally, the Demarker Indicator is obtained by dividing the DeMax simple moving average by the sum of the DeMax simple moving average and the DeMin simple moving average. Therefore, the greater the value of DeMax than DeMin, the greater the value of the Demarker Indicator.
How to signal and read the demarker Indicator
The marker Indicator is relatively easy to use. You have to pay attention to the trending chart you want. As with many other hands, it is generally not recommended to use Dimarker in range markets.
First, check the period of the chart. The chosen period should be in line with your trading strategy. By default, the Dimarker indicator is used in 14-period intervals. However, it is also possible to change the timeframe and color of the Indicator in many trading platforms.
After checking the details of the Indicator, apply it to the chart. How to read the darker Indicator is as follows:
- On a scale of 0 to 1, values greater than 0.7 indicate areas of oversaturation and the possibility of a price drop.
- Values below 0.3 indicate that the asset is oversold, and the price will likely rise soon.
- Values between 0.3 and 0.7 indicate relatively low-risk periods to enter the market.
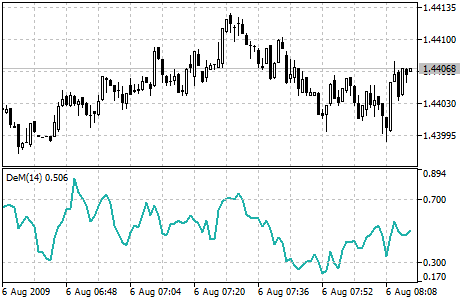 Demarker indicator image; Oversold in amounts less than 0.3 and oversold in areas greater than 0.7
Finding the divergence with Denmark
Divergence occurs when the asset price chart differs from the oscillator volatility chart. Professional traders can benefit from Dimarker divergence as well as other oscillators. Note, however, that variations are usually rare, and to confirm them, you must use several different oscillators. Also, it should be noted that finding deviation in oversold and overbought areas works better in range markets.
In the chart below, you can see two upward and downward divergences in two different areas of the graph. The price creates two consecutive lower valleys in an upward departure. At the same time, the other oscillator does not confirm the second valley. The oscillator rises above the 0.3 level (when the market is no longer in the oversold zone), and you can enter a long trade (buy). Also, the best time to exit the market is when the oscillator drops below the overbought zone.
The chart below shows that the price forms a bearish divergence right after the bullish divergence, which is the opposite of what we assessed. A bearish divergence occurs when the price makes higher peaks successively, But the oscillator does not confirm the second peak. In this case, thinking about short trade (selling with the same logic as we have explained) is better.
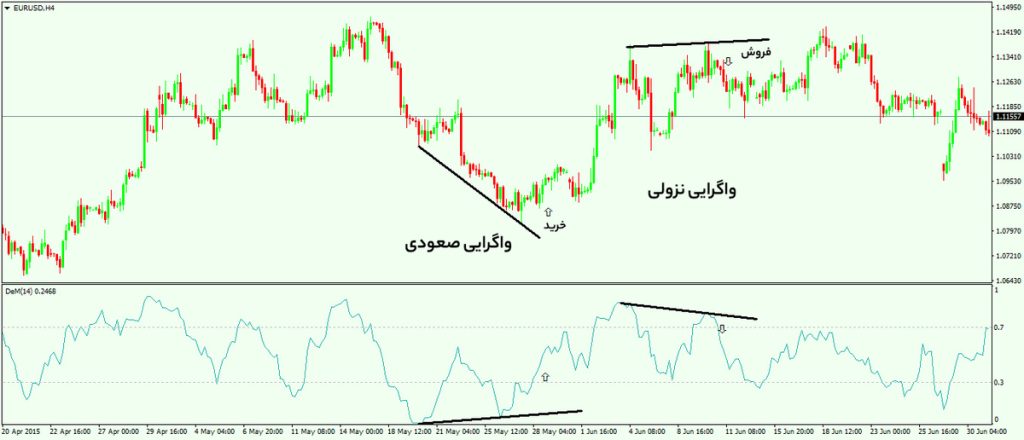 Finding divergence with the Dimarker indicator
The second method is to use darker divergence.
Another way to use the Dimarker indicator is to use levels. With the classic method we explained in the previous section, the price and the oscillator had to move in the opposite direction to form a divergence. However, even if the price and the oscillator have a similar trend in the second method, it is still possible to signal. In this case, the oscillator should break out from the overbought range (above the 0.7 level) or the oversold range (below the 0.3 level).
In a more cautious mode, you can also wait until the base level breaks; That is, to enter the trade, wait for the oscillator to cross the 0.5 level a little. Breaking the 0.5 level downwards is an excellent sign to buy, and breaking the 0.5 level to the high side is a good sign to sell.
Introducing the Sequential Indicator of Dimark
Tom Demark’s Sequential Indicator is a powerful tool for identifying the exact time of a decline and trend reversal. The TD Sequential Indicator is successful in the early detection of market turning points. This tool helps traders in range markets and other indicators to benefit most from market fluctuations. the
TD Sequential Indicator can be used in any time frame and market condition. However, the most reliable time frame for utilizing this Indicator is four hours and more. Also, it is interesting to know that it is possible to change the rules and instructions of the sequential Indicator; Therefore, you may see different types of this Indicator in other sources and platforms. It is also important to mention that the TD Sequential Indicator only works on candlesticks or bar charts.
Sequential indicator phases
The sequential Indicator consists of two main phases; the end of each step gives the trader a trend reversal signal:
- The setup phase, known as the momentum phase, works with nine candles.
- The Countdown Phase, the Trend Exhaustion Phase, uses 13 candles.
Both sequential phases begin after a trend reversal and, if completed, indicate a potential valley or peak. Also, the second countdown phase is only valid if the start phase has been created and completed.
This Indicator also creates resistance and support levels, called TDST lines, and are drawn at the same level as the highest or lowest price in the first candle of the starting phase. Thus, the high price in the first candle of the beginning phase is considered the resistance level, and the low price in this phase’s first candle is regarded as the support level.
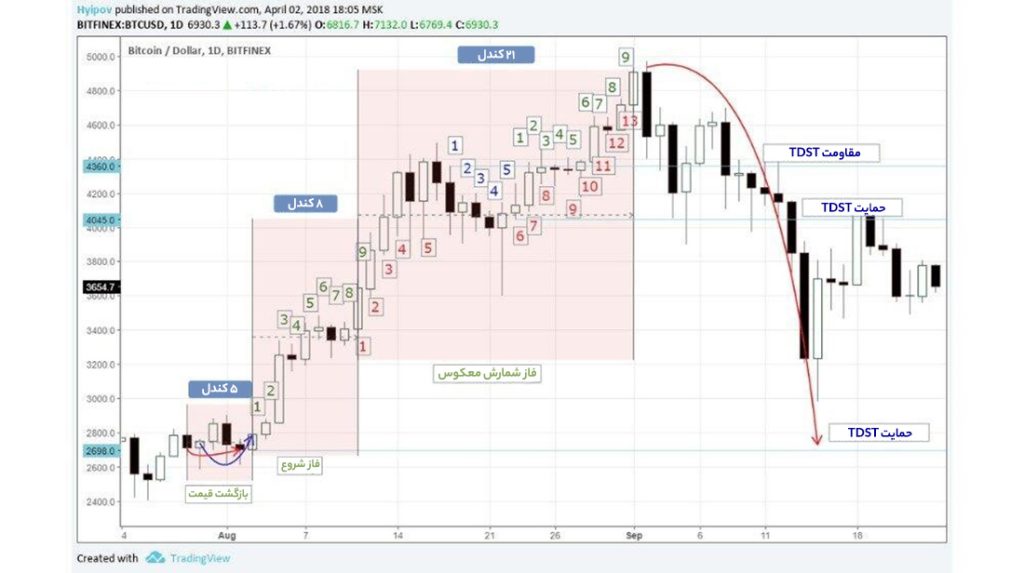
As you can see in the chart above, if you use the Sequential Indicator in your chart, you will see different numbers above or below each candle. These numbers are inserted from 1 to 9 for the start phase and from 1 to 13 for the countdown phase.
How to calculate the starting phase
As mentioned, the Sequential Indicator can be used in ascending and descending directions. In the upward trend, the first candle of the start phase is calculated and marked with the number 1 if it closes at a price higher than the closing price of the previous four candles (candle a in the image below). Similarly, the second candle of the phase is also considered in the Indicator when it closes at a price higher than the closing price of the previous four candles (candle b in the image below).
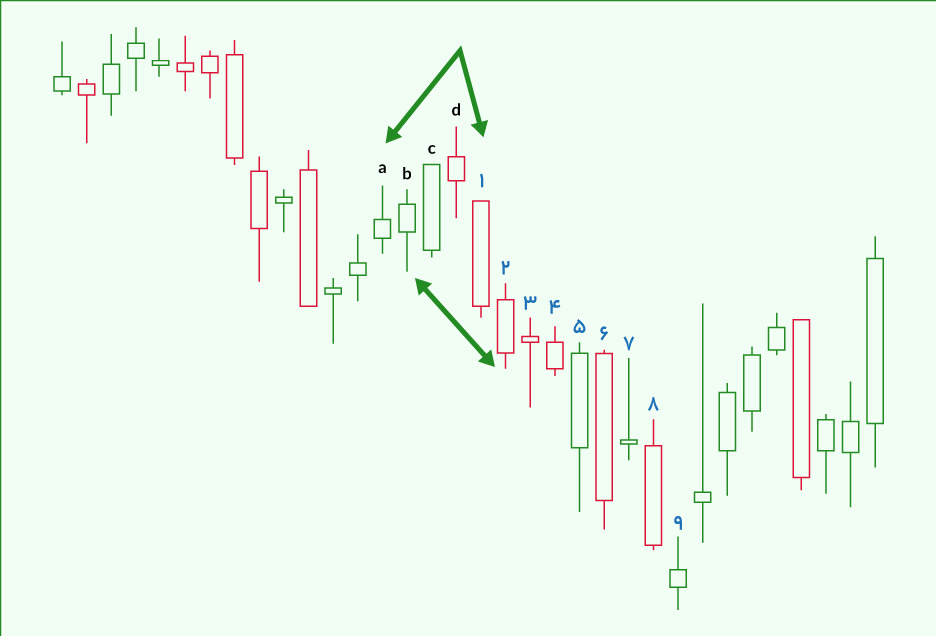
The start phase of the sequential Indicator is completed when the ninth candle closes at a price higher than the closing price of the previous four candles. In the meantime, if even one candle closes at a price lower than four candles before it, the Indicator is immediately canceled, and you have to start again from the beginning. The best case for the opening phase is to create the 8th and 9th candles above the high prices in the 6th and 7th candles.
The same calculations apply to the downward trend; the first candle should be closed at a price lower than the closing price of the four candles. Like the starting phase in an uptrend, this phase is completed when the ninth candle closes at a price lower than the closing price of the previous four candles.
Similar to an uptrend, in a downtrend, even if a candle closes at a price higher than the previous four, the Indicator is immediately canceled, and you have to start over. The best case for the starting phase is to create the 8th and 9th candles below the low prices in the 6th and 7th candles.
Signaling from the start phase
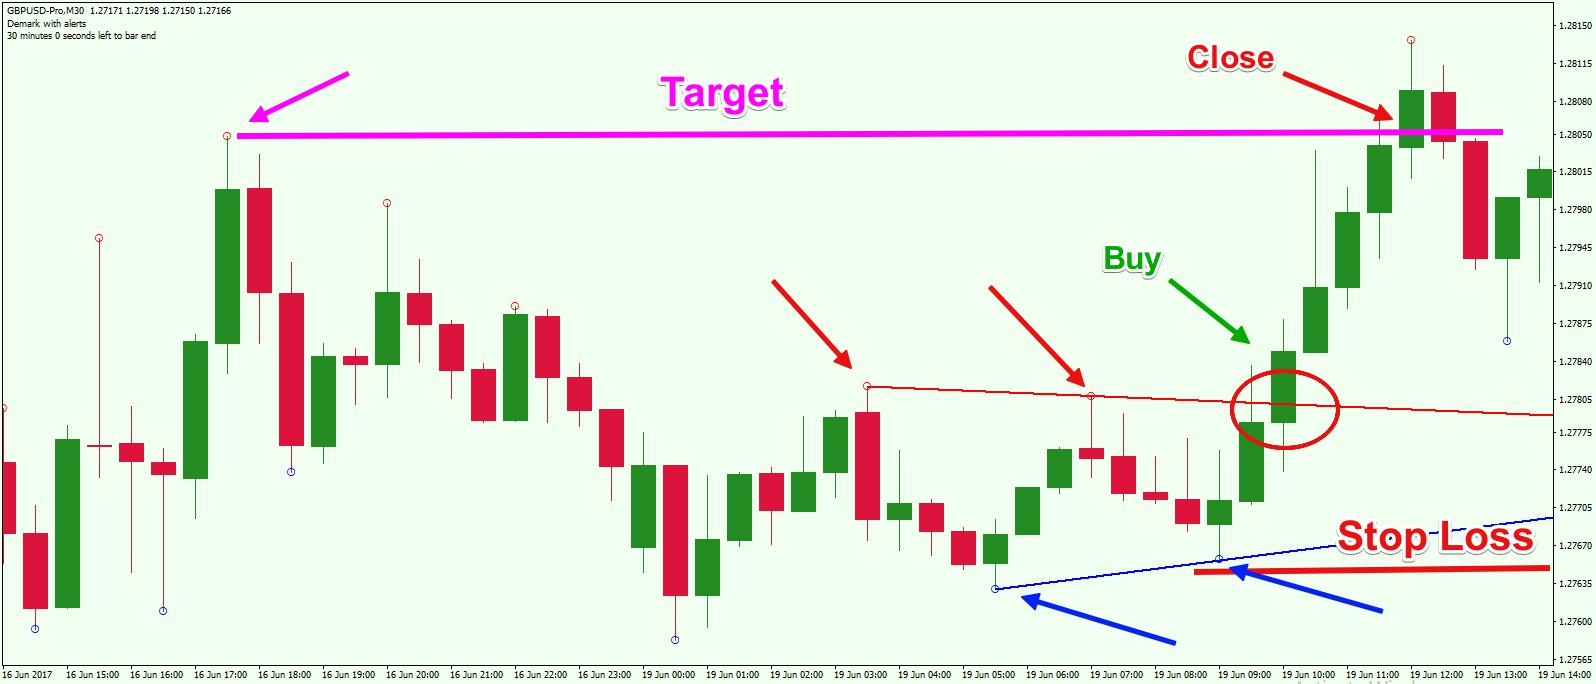
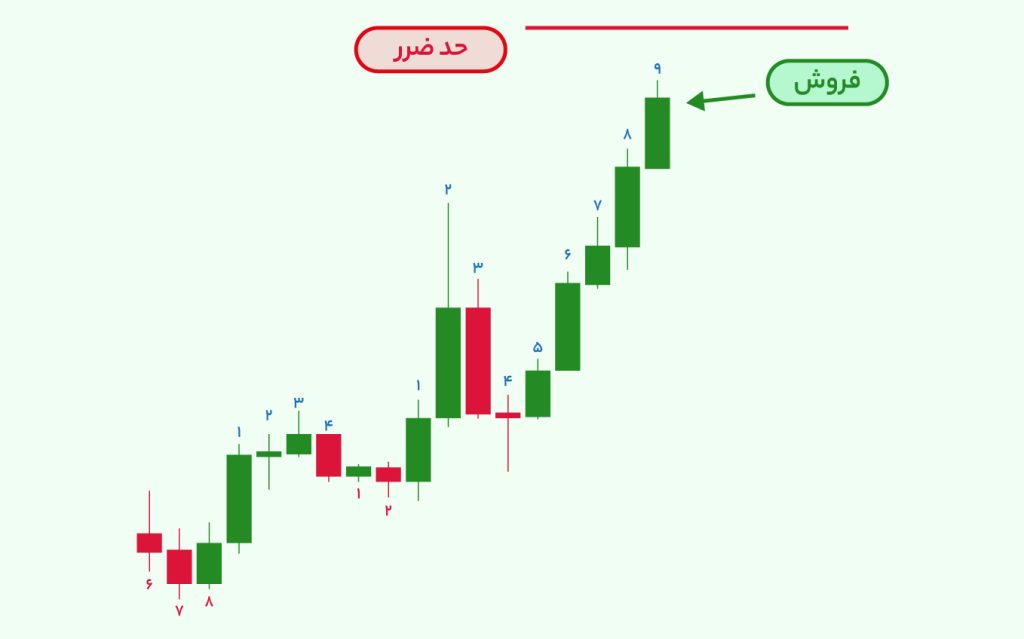
If nine candles are completed, we face the possibility of reversing the trend. Candle number 9 is ideal for entering a trade against the current trend. Also, it is better to set a stop loss higher or lower than the high or low price of the 9th candle.
After the confirmation of the ninth candle, especially if none of the opening phase candles has crossed the TDST support or resistance line, the power of the pullback that occurs in the next three to four candles will be very high. Also, ideally, the 9th candle should close to the TDST line.
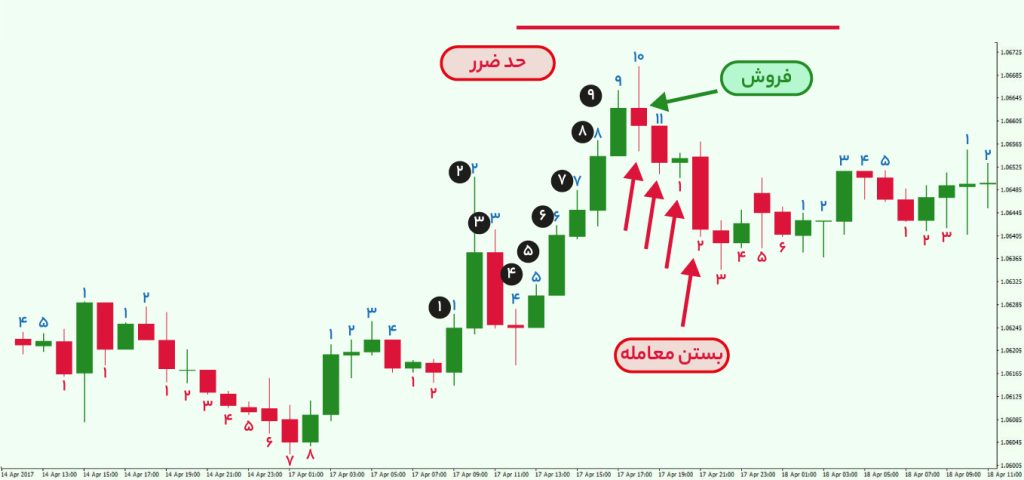
Therefore, the best entry point using this Indicator is after the completion of candle number 9, and the best moment to create a stop loss is slightly higher than the high price of the last candle in the current trend. In the picture below, when we are facing an upward trend, we consider the loss limit at a relative distance from the high price of the last ascending candle; So that possible fluctuations when the trend returns do not cause the loss limit order to be executed.
In the strategy based on the sequential Indicator, there is no specific instruction for targeting; However, since the trend is likely to be strong after the reversal in the first four candles, it is best not to exit the trade before these four candles close.
How to calculate the countdown phase
The calculation of this phase starts when the start phase is completed and confirmed. The countdown phase consists of 13 candles, where the closing price of each candle is compared with the closing price of the previous two candles. In the countdown phase, depending on the ascending or descending trend, candle number 1 must be closed at a price higher (in the ascending countdown) or lower (in the descending countdown) than the closing price of the two candles before it.
One of the essential differences between the countdown and start phases is that there is no need for a sequence of candles. This means that if one of the candlesticks cannot create a higher or lower price trend than the closing price of the previous two candles, there will be no disruption in the indicator trend. Even the numbering of the first candle may be postponed until the conditions are ready, But the Indicator is not canceled.
Signaling from the countdown phase
To complete the countdown phase and receive the trend reversal signal, the closing price of the 13th candle should be higher (in an upward trend) or lower (in a downward direction) compared to the previous two candles, but also higher or lower than the closing price of the number 8 candle. If these two conditions are fulfilled for the 13th candle, we must wait for a new candle that meets these two conditions.
After these two conditions are fulfilled, we will probably face a price reversal. With the completion of the 13th candle of the countdown phase, a new trend begins in the opposite direction of the current one, which is often powerful and lasts for several consecutive candles.
Other Tom Demark indicators
Tom Dimark indicators have different types and are used in different market conditions. We should always consider combining these indicators with other technical analysis tools. Undoubtedly, any experienced trader knows that no single indicator can accurately predict the market. The diversity of TD indicators allows traders to build strategies based on several indicators.
Another widely used Tom Demark indicator is the Tom Demark combo indicator (TD Combo). This Indicator can help traders detect the trend’s weakening and the possibility of its return. This Indicator works almost the same as the sequential Indicator. But it works better in more intense market movements; Because instead of 22 candles, it is completed with only 13 candles. In general, the strength and accuracy of a signal increase when both combo and sequential indicators confirm it; Therefore, the combined use of these two TD indicators can effectively detect the possibility of a trend change.
How to calculate and read the combo indicator
The combo, similar to Sequential, has two phases: start and countdown; However, there are differences between these two indicators. For example, the first candle of the countdown phase begins from the first candle of the starting phase, and unlike the sequential, we do not need to wait for the creation of the ninth candle. Like other Tom Demark indicators, the combo indicator works in bullish and bearish conditions.
Also, other prerequisites in this Indicator must be met, some of which are:
- The closing price of each candle should be equal to or lower (in the downward trend) and higher (in the upward direction) than the low price of the previous candles.
- The low price of each candle must be equal to or less (in a downtrend) and more (in an uptrend) than the low price of the previous candle.
- The closing price of each candle should be lower (in the downtrend) and higher (in the uptrend) than the closing price of the previous candle.
It should be mentioned that the combo indicator can be changed like other Dimark indicators, and different traders use different rules to use this Indicator. Also, it is interesting that the number and variety of Tom Demark’s hands, primarily those based on the sequence of numbers and the counting of candles, do not end here. Indicators such as Camouflage, Clop, and Trap can also help technical market analysts in particular situations.
Summary _
In this article, we examined Tom Dimark’s indicators, i.e., Dimarker and Sequential, in detail and explained how to calculate them and the signaling methods from each. Also, we said that Tom Dimark indicators have many and varied types, and every trader can benefit from these technical analysis indicators according to his trading strategy.
Tom Dimark’s indicators help analyze and evaluate the current trend, and many professional analysts use them in various financial markets. These indicators are suitable tools for trend detection, signaling, and risk management in different strategies. Dimark hands generally emphasize detecting when the trend is reversing. Demark himself believed that:
The process [is] your friend until it’s over.
However, neither Tom Dimark nor other technical analysis indicators can be used alone to identify the flagging market trends. Every trader’s trading strategy should consist of various indicators so that specialized analysis tools can provide a more comprehensive assessment of market sentiment by negating and confirming each other.