


What is the Boston Matrix?
In the 21st century, it is very challenging for a business to survive in intense competition. But these challenges can be overcome to some extent by using different business strategies, including the Boston BCG matrix.
The Boston Consulting Group Matrix, also known as the Boston Consulting Group Matrix or the Boston Portfolio Matrix, was developed by the founders of the Boston Consulting Group in 1970 to help companies better evaluate their business units.
Companies can use this matrix as an analytical tool in Resource Allocation, Product Management, Strategic Management, and Modern Portfolio Analysis. In this article, after introducing you to the important concepts of this matrix. We will examine the ways to use it in business.
What is the Boston Matrix?
According to the Boston Consulting Group (BCG) website, the Boston Matrix strengthens the skills they need to analyze their products to increase the efficiency and profitability of companies. In some cases, even change the revenue model of the organization.
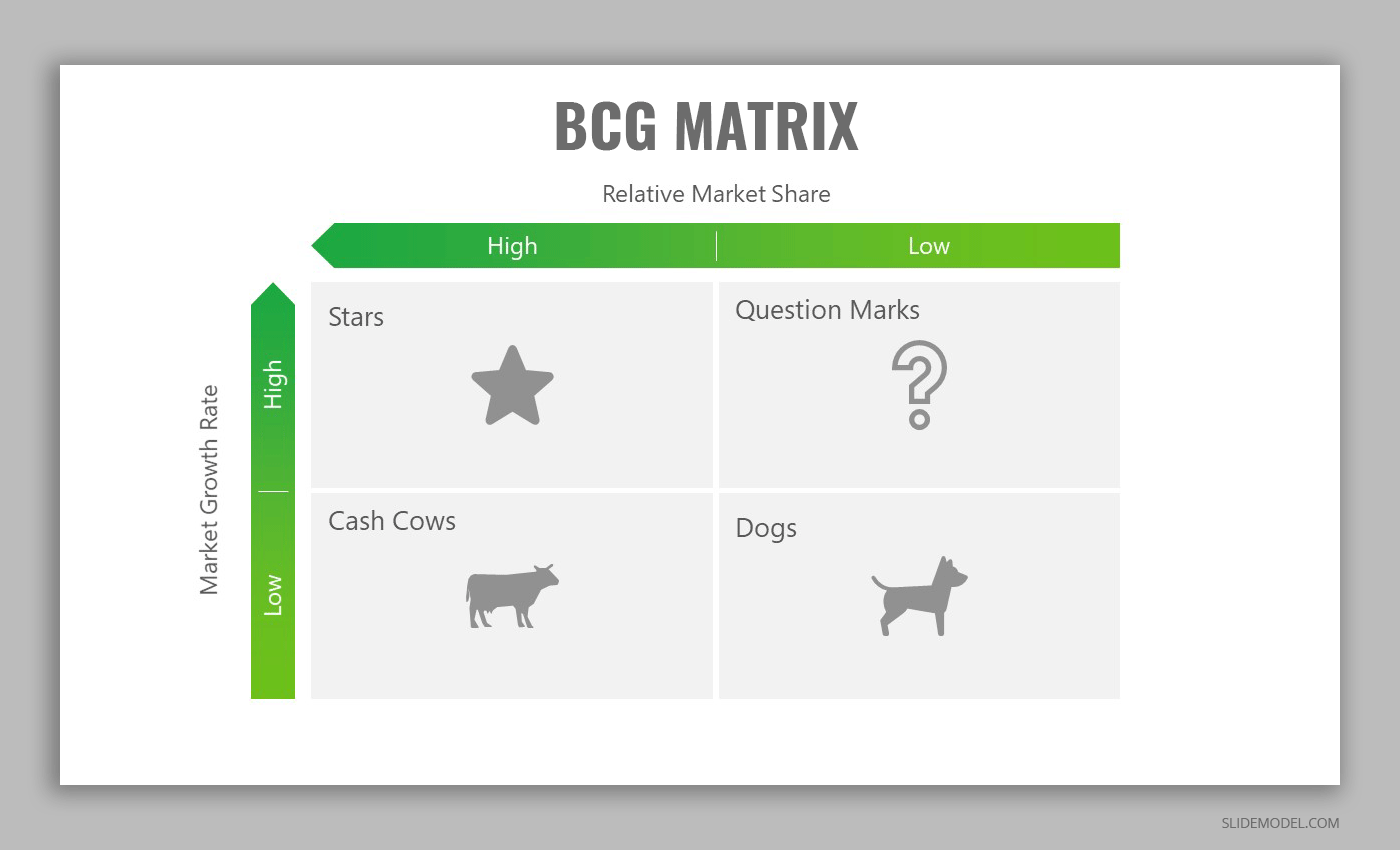
The Boston Matrix is the most popular and simplest Portfolio Planning Matrix globally, with the help of which all companies create a standard balance and range for their products. The Boston Matrix coordinates the four categories of products that an organization produces. These four categories are:
1. Question Marks – Low market share and high market growth
Question mark units are business units with a smaller share of High Growth Markets. Most businesses start at this point. This business unit can increase market share and become a star unit or, if market growth slows, lose more share and be reduced to a dog unit.
So question marks are opportunities that no one knows how to handle. They do not generate much revenue at the moment because your organization does not have a large share of the competitive market. But these products are in a fast-growing market, so if you can increase your market share, they can become star products or dairy cows. On the other hand, if you do not increase your market share, the question marks may have high costs and very low returns and become a dog unit.
2. Stars – High market share and high market growth
Businesses and products are growing rapidly in this part of the Boston matrix. There are good opportunities in this sector that we must do our best to achieve greater profitability. In other words, a star unit is a business unit that also has a large market share in fast-growing businesses. Such products have a very good position in a completely transparent market. Therefore, they need large amounts of budget and capital to compete with other competitors to maintain their growth rate.
However, after the inevitable slowdown in business growth, corporate executives convert star units to dairy cows. For this reason, if the company can maintain its position as a successful and leading company in the market, star units will automatically and potentially become units of lactating cows. Still, otherwise, star units will become units of dogs.
3. Cash Cows – High market share and low market growth
This category’s products and business units are in a market with slow growth but occupy a large share. The income generated from producing these products is more than the investment required to produce them. Usually, the product produced in the dairy cattle sector is an old and uniform commodity offered in the Mature Market so that the company produces it solely to earn money. In other words, by producing these products, the company tries to achieve the maximum utilization and profit with the least possible investment.
The products available in the dairy cattle sector are usually well established in the market. Due to their great popularity among customers, they make it easy for you to take advantage of new opportunities in the market. However, due to the low growth of the market, your maneuverability on those products is very low.
4. Dogs Unit – Low market share and low market growth
These are product lines or products with a small share in a low-growth market. Of course, this does not mean that these product lines do not return the capital they paid for to the company’s shareholders, but rather that they do not lead to profitability and maintain only a small market share.
In general, these units are not valuable in terms of revenue potential. Still, they have other benefits, such as job creation for other company business units. Sometimes these benefits are so convincing that the company keeps these business units active despite their not-so-attractive market position. Of course, sometimes dog units harm investors’ judgments about the company’s management, so it is best to have these production lines disbanded or divested. Where market share needs to be maintained, special discounts should be applied to these products.
The natural cycle of business units
The natural cycle of most products or business units is that they first fall into Question Marks and then become Stars after the market improves. As time goes on and the market slows down. The star clusters also turn into Cash Cows units and eventually reduce to dog units. According to the Boston Consulting Group, companies with a balanced portfolio will make the most of their capabilities through better investment. A balanced portfolio includes the following:
- Star units to ensure the survival and success of the company in the future
- Question Marks units that become Star units with a small investment
- Cash Cows units for future investment and growth
The main axes of the Boston matrix
Familiarity with this matrix’s two main axes, market share (Relative Market Share) and market growth (Growth Market), is essential for effective and better use. It would help if you understood how to connect the two.
Market share is the percentage of the total market that your product or business has and is measured based on the components of revenue and the volume of that unit. The more market share you have, the more you will have. According to the Boston Matrix, if you have a large market share, you will also make a good profit because you have theoretically learned how to maximize the profitability of your products.
According to the Boston matrix, you have to ask yourself because this particular product is money-making. Should more capital be considered for it or not? Of course, you must answer this question by examining the growth of the product market in detail.
Market growth measures the attractiveness of a market to enter a product. High-growth markets are highly attractive for injecting a product. Business executives have many opportunities to increase their profits in these markets. In contrast, low-growth markets are not attractive for a product to enter, so competition in them is useless. Therefore, you must constantly use discounts and other sales techniques to maintain your market share.
How to use the Boston matrix?
Step 1. Unit/product selection
The BCG matrix can analyze products, business units, brands, and product lines. This choice affects our market analysis so that determining the industry, competitors, and brand position depends on the selected unit.
Step 2. Market definition
After selecting the desired unit or product, the most important step to continue working with the BCG matrix is to define the market. Incorrect market definition leads to incorrect classification of the desired unit. For example, if we look at Rolls-Royce based on the youth and sports car market. Its products are in the dog unit with a small market share. But if we analyze it in the luxury car market, its products. A good example would be a dairy cow unit.
Step 3. Calculate the relative market share
At this point, we need to calculate the relative market share for the selected unit/product. Therefore, we will do this based on revenues or market share and using the formula (dividing the revenue from that product by the revenues of the biggest competitor of that product). The resulting number is on the x-axis of the BCG matrix.
Step 4. Calculate the market growth rate
You can use the online reports about that business to find the growth rate. If this is not possible for you, you can also estimate the growth rate of your business market according to the average revenue growth of strong and leading companies in that field. The number obtained is a percentage placed on the y-axis.
Step 5. Draw a circle in the matrix
After completing all the calculations, you need to put the result in the Boston matrix. You can do it by drawing a circle for each product in each unit or all of a company’s products. The revenue from that product determines the size of each circle.
BCG matrix in Coca-Cola
Stars: Coca-Cola products called Fanta and Sprite fall into this category due to their large market share.
Question mark: The Kinely mineral water falls into this category in the growing market. This area has not achieved good sales and needs to strengthen sales areas.
Lactating cows: Coca-cola is in this category because it is almost unrivaled globally.
Dogs: Coca-Cola Zero Diet Coffees and Drinks do not attract many customers and require long-term sales strategies. So these products fall into the dog category.
Boston Matrix Constraints
First, the Boston Matrix only looks at the impact of Relative Market Share and Growth Market on the profitability of a company’s products. In addition, the Boston Matrix assumes that high market share leads to high profits, which sometimes proves otherwise.
For example, maintaining a high market share requires a lot of continuous investment, which creates various problems for your organization. In addition, companies may sometimes think that products in the dog category waste resources and capital. But these products can help sell other products and offer complimentary offers to customers.
Another limitation of the Boston matrix is that it assumes that the growth potential of dairy cow products is limited and that organizations should invest the profits from their sale in star products or new products. In comparison, organizations should use this capital to maintain the position of dairy cattle products or even to revive them in the new market.
Conclusion
This article introduces a useful tool called the Boston Matrix or BCG and examines its four main parts. It includes the question mark, star, lactating cow, and dog. In addition, we analyzed the two components of market growth and market share and finally listed the limitations and weaknesses of this matrix. By observing all these features, if this matrix is in the right place and other analytical marketing tools, it can show attractive and suitable investment options to strategists and managers of the organization.