


What Does Cluster Analysis Mean In The World Of Artificial Intelligence?
Cluster Analysis Is A Statistical Method Used To Classify Data Into Similar Groups. In This Method, Data Are Grouped And Divided Into Cluster Groups Based On Their Similarities And Characteristics.
Cluster analysis aims to group complex data into smaller and more manageable groups.
What is cluster analysis?
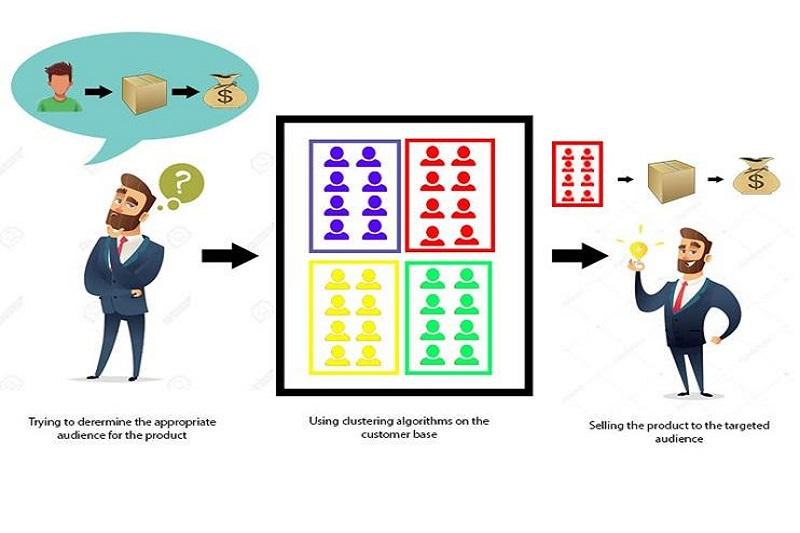
Cluster analysis is an unsupervised machine-learning technique used to identify similar groups in data. Clusters are groups of data that are close together in terms of similar characteristics. Cluster analysis can identify customer groups, product groups, and the like.
Today, there are different types of cluster analysis, each with its advantages and disadvantages. One of the most common types of cluster analysis is K-means cluster analysis. K-means cluster analysis divides the data into K clusters, where K is the desired number of groups. The clusters are selected so that the distance between the data in each set is the smallest possible value.
Cluster analysis is a powerful tool for identifying similar groups in data. However, it is essential to note that cluster analysis is an unsupervised machine-learning technique. More precisely, cluster analysis cannot tell you what each cluster is. You must interpret the meaning of the clusters using your knowledge of the data.
Advantages of using cluster analysis:
- It can be used to identify similar groups in the data.
- It can be used to reduce data complexity.
- It can be used to discover patterns in data.
- It can be used to predict the behavior of data.
Disadvantages of cluster analysis :
- It can be complicated.
- It can be time-consuming.
- It can require a lot of knowledge about the data.
- It can require a lot of data.
In cluster analysis, the input data are defined as multidimensional vectors, each dimension of which represents a feature. Then, clustering algorithms divide the input data into cluster groups. As we mentioned, one of the most famous clustering algorithms is K-Means, which works based on the centrality of clusters and optimizes to obtain the best partition into a certain number of groups.
Cluster analysis is used in many fields, such as psychology, social sciences, economics, e-commerce, etc. For example, in social sciences, cluster analysis can be used to group people with similar characteristics into a group. In e-commerce, cluster analysis can categorize customers based on their purchasing behaviors.
What is the K-Means algorithm?
K-Means is one of the most popular clustering algorithms to group data into similar cluster groups. In this algorithm, several central points (centroid) are created randomly, and then the data are divided into cluster groups close to the determined center. New centers are calculated in the following, and the data is redistributed based on the new centers. This process continues iteratively until no other centers are built, and the final division is obtained.
The performance of the K-Means algorithm is calculated based on the Euclidean distance between points and centers. The Euclidean distance between two points in n-dimensional space equals the square root of the horizontal, vertical, and depth distances between those two points.
The advantages of the K-Means algorithm include its simplicity and speed of implementation. Also, due to the simplicity of calculations, this algorithm works well for extensive data. However, a point to consider is that K-Means does not perform well for data whose original shapes are not included because it is based on the Euclidean distance. Also, the algorithm may reach unfavorable results if the number of clusters is not set correctly.
Is K-Means consistently unfavorable for data with non-rotating shapes?
No, the K-Means algorithm does not always perform poorly for data with non-circular shapes, but it may provide unfavorable results in some cases due to the type of data.
The K-Means algorithm does not perform well for data whose main shapes are not rotated because the K-Means algorithm is calculated based on the Euclidean distance between points and centers and looks for centers that are close to the center. But in data whose shape is not circular, the Euclidean distance between points and centers can be meaningless and may lead to undesirable results.
For this reason, other methods, such as Hierarchical Clustering, Graph-based Clustering, and Similarity-based Clustering, can work better for data whose shape is not circular.
How to set the number of clusters correctly?
Setting the number of clusters for the clustering algorithm is one of the most fundamental issues in this field. The number of groups should be such as to help the accuracy and quality of clustering. In the following, we will examine some methods to adjust the number of groups:
- Elbow Method: In this method, the SSE value of the Sum of Squared Errors is calculated for the number of clusters. Then, the SSE diagram is drawn in terms of the number of groups, and the transition point of the most severe SSE reduction in the diagram is considered the optimal number of clusters. The name of this method is due to the similarity of the SSE chart with the shape of the elbow.
- Dendrogram method: In this method, which is used in Hierarchical Clustering, the hierarchical diagram of the clusters is drawn. Then, the number of groups that seem optimal according to the investigated problem is selected by looking at the chart.
- Neural Networks method: The optimal number of clusters is determined for the data using neural networks. In this method, neural networks are trained with different groups, and the number of groups that show better performance is considered the optimal number of groups.
- Automatic measurement method: In this method, the number of clusters is determined automatically by clustering algorithms. For example, in the DBSCAN method, the number of groups is selected automatically.
In any case, setting the number of clusters is a complex issue. It should be done with precision and expert knowledge according to the characteristics of the data and the problem under investigation.
Are there any problems with setting the number of clusters for high-dimensional data?
Setting the number of clusters for high-dimensional data can become a complex problem due to excessive dimensions. As the number of sizes increases, the volume of data becomes very large, which can cause data analysis problems. For example, in high-dimensional data, distance and similarity between data become much more complicated, and clustering algorithms based on length and similarity may lead to unfavorable results.
Methods such as dimensionality reduction can be used to deal with this problem in high-dimensional data. These methods can help the accuracy and quality of clustering by reducing the number of data dimensions. For example, you can use PCA (Principal Component Analysis) and t-SNE (t-Distributed Stochastic Neighbor Embedding) methods to reduce the data dimension.
Now, we come to the critical question of whether dimensionality reduction methods are always the best solution for clustering high-dimensional data. The answer is no; dimension reduction methods are not always the best solution for pressing high-dimensional data. Using dimensionality reduction methods to push high-dimensional data may lead to undesirable results. For example, in some cases, using dimensionality reduction methods may cause the loss of some vital information in the data, which can cause unfavorable clustering results.
In addition, dimensionality reduction methods for high-dimensional data may be associated with problems such as increased computation time and model complexity. Sometimes, using dimension-reduction methods may cause errors in the clustering results.
For this reason, dimension reduction methods should be used carefully and according to the characteristics of the data and the problem under investigation. In some cases, other methods, such as Hierarchical Clustering, Graph-based Clustering, and Similarity-based Clustering, which we will mention below, can be the best solution for clustering high-dimensional data.
In general, setting the number of clusters for high-dimensional data is a challenge and requires data analysis accuracy and expertise and choosing the correct method for clustering.
What other clustering methods are there?
In addition to the K-Means algorithm, there are other clustering methods. Below I mention some of these methods:
- Hierarchical clustering method: In this method, clusters are formed hierarchically. At first, each data is considered a cluster; then, the sets are recursively divided into smaller groups to reach the final groups. This method is suitable for examining low-volume data due to its high interpretability and no need to determine the number of clusters.
- Graph-based clustering method: In this method, data are considered graph nodes, and clusters are formed as subgraphs with the most significant number of edges. This method is suitable for data that has a graph structure.
- Clustering method based on probability distributions (Probabilistic Clustering): In this method, it is assumed that the data follow certain probability distributions. Then, using probabilistic models, clusters are formed. This method is suitable for data whose probability distribution can be estimated.
- Similarity-based clustering method: Data are grouped based on their characteristics in this method. This method is suitable for data that cannot be grouped linearly.
- Neural Network-based Clustering method: In this method, neural networks are used for data clustering. By training neural networks, better clusters are created.