


An Introduction of Google Data Studio
This tool is considered an automatic report generator for employers that can provide all the information needed by an SEO job in an excellent way to create the best options for website optimization. This tool collects information about all the scripts and codes we inserted into our site codes by Google Tag Manager.
What is Google Data Studio?
Google Data Studio is a powerful free tool provided by Google that allows users to translate and analyze their data in the form of interactive reports. Using Goal Data Studio, you can prepare reports from various sources, including Google Analytics, Google Ads, Google Sheets, MySQL databases, and other data sources.
Google Data Studio is highly customizable and gives valuable features to enhance your data’s display for better analysis and understanding. Also, this tool allows you to share and share your reports online and in print.
Although Google Data Studio is a free tool, you can prepare complex and professional reports simply and understandably for everyone. As a type of BI (Business Intelligence) tool, it allows users to manage information to make better decisions in their business.
The reason for using Google Data Studio
Surely you know that real-time reporting is essential for digital marketing or more and better website reviews, right?
Google Data Studio allows you to create better and more efficient strategies for your website’s SEO than before because it reports valuable information about many things, such as customers, users’ interaction with the website, or how Google behaves. With the site and analytical review of competitors… it can be an essential tool.
How to create clear and understandable reports with Google Studio
Google Data Studio is a powerful tool for analyzing and displaying data, allowing you to show your data in reports and dashboards with a visually stunning and professional view. To use, follow the steps below:
1- First, you must have a Google account. If you do not have a Google must create a new one.
2- Then go to the main page of GOngle Studio (studio.cangle.com) and create a new report to start.
3- On the new page, you can add your data sources, such as Google Analytics, Google Sheets, Google Ads, etc. To do this, click the “Add Data” button and select the desired data source.
4- After adding the data source, you can create your desired output using the tools available in Google e Studio. For example, you can add graphs, tables, scatter plots, etc., to your report.
5- After creating the report, you can share it with others. To do this, click the “Share” button and send the sharing link to your friends and colleagues.
6- Finally, you can use your reports and dashboards as a PDF, Excel, or CSV file.
From now on, you can display your data professionally and attractively on Google Data Studio, analyze dat, and make better decisions.
Training to use for data analysis
To use Google Data Studio to analyze your data, it is best to follow these steps:
Add data sources
At this point, add your data sources using the “Add Data” menu on the left side of the window. Google Data Studio supports various data sources such as Google Analytics, Google Sheets, and Google Ads.
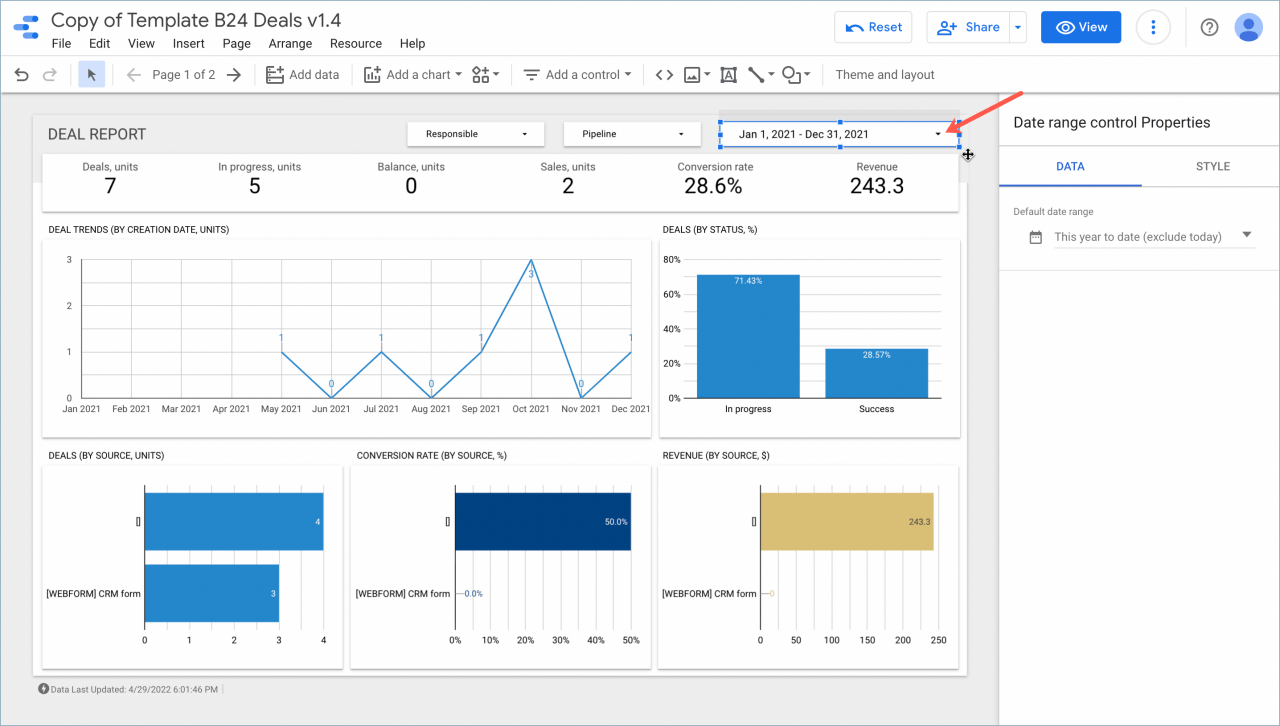
Dashboard design
After adding data sources, you can design your dashboard using the available tools. You can add sidebar elements to your dashboard by drag-and-drop and customize them.
Create reports
Adding different sections to your dashboard allows you to create reports that help you analyze your data. Reports include graphs, tables, and texts.
Sharing the dashboard
If you want to share your dashboard or report with others, you can use the Share option at the top of the page and specify the access of others to your dashboard or report.
Save the dashboard
Finally, when you’re done with the dashboard, save it using the Save option at the top of the screen to access it when needed.
These simple steps give you a detailed and comprehensive data analysis.
How to customize your dashboards
You can use the tools in the “Style” section to customize your dashboards in Google Data Studio. Here are some explanations in this regard:
Dashboard formatting
You can change the formatting of your dashboard using the “Theme” option. You can use the default templates or edit them to get the best view of your data.
Change colors
You can change your dashboard’s background and text colors using the “Colors” option. By changing the colors, your dashboard will be arranged more attractively.
Set the font
You can change the font in your dashboard using the “Font” option. This creates a uniform look for your dashboard and makes it look more professional.
Add title
You can add the title of your dashboard using the “Title” option. The title should contain something to grab users’ attention and define the purpose of your dashboard.
Set background
You can change the background of your dashboard using the “Background” option. You can use different images, colors, and patterns to display your dashboard uniquely and attractively.
Setting charts: You can customize your charts using the “Chart Style” option. You can change the type of chart, its colors, and other parts so that your chart is displayed optimally and understandably.
Using these tools, you can display your dashboards in a customized, professional, and attractive way.
Optimizing images and videos for use in Google Data Studio
Optimizing photos and videos are vital, as these factors can significantly affect the quality of your reports and dashboards. Some methods of optimizing images and videos for use in Google Data Studio will be discussed below:
1- The right size
The volume of images and videos can be significantly high, which can slow down the download speed of the report. To solve this problem, resizing images and videos to the correct size before downloading them is better. The best image size in Google Data Studio is about 1200×628 pixels, and the aspect ratio is 1.91:1.
2- Appropriate format
PNG, JPEG, and GIF are suitable image formats for use in reports and dashboards. However, for videos, MP4 is the perfect format.
3- Reduce file size
You can use image and video optimization tools to reduce the size of images and videos. Some free tools like TinyPNG and Compressor.io can help you reduce the size of your files significantly.
4- Alt tag
Add alt tags to your images to improve SEO and accessibility for blind users. This tag gives search engines information about your idea.
5- Using the correct name
To optimize SEO and improve accessibility for blind users, save your images and videos with appropriate terms and accurate descriptions.
You can optimize your images and videos for use in Google Data Studio using these solutions.
How to use Google Data Studio to predict and analyze user behavior
Google Data Studio is a robust web data analysis tool that allows you to collect data from sources such as Google Analytics, Google Ads, and others and present them in understandable reports. And visualize visibly.
You can use various tools such as graphs, tables, and dynamic reports to predict and analyze user behavior using Google Data Studio. With these tools, you can identify the users’ behavior patterns and check the changes that occur in the conduct of the users.
For example, you can create attractive and understandable charts using Google Data Studio to predict the number of site visitors, conversion rate, average visit time, and other essential metrics. Also, you can check user behavior patterns and find the best solutions to improve the user experience on your site.
Due to the many features, any analysis and prediction of user behavior can be done quickly using this tool.
Predicting the effectiveness of online advertising and optimizing advertising costs
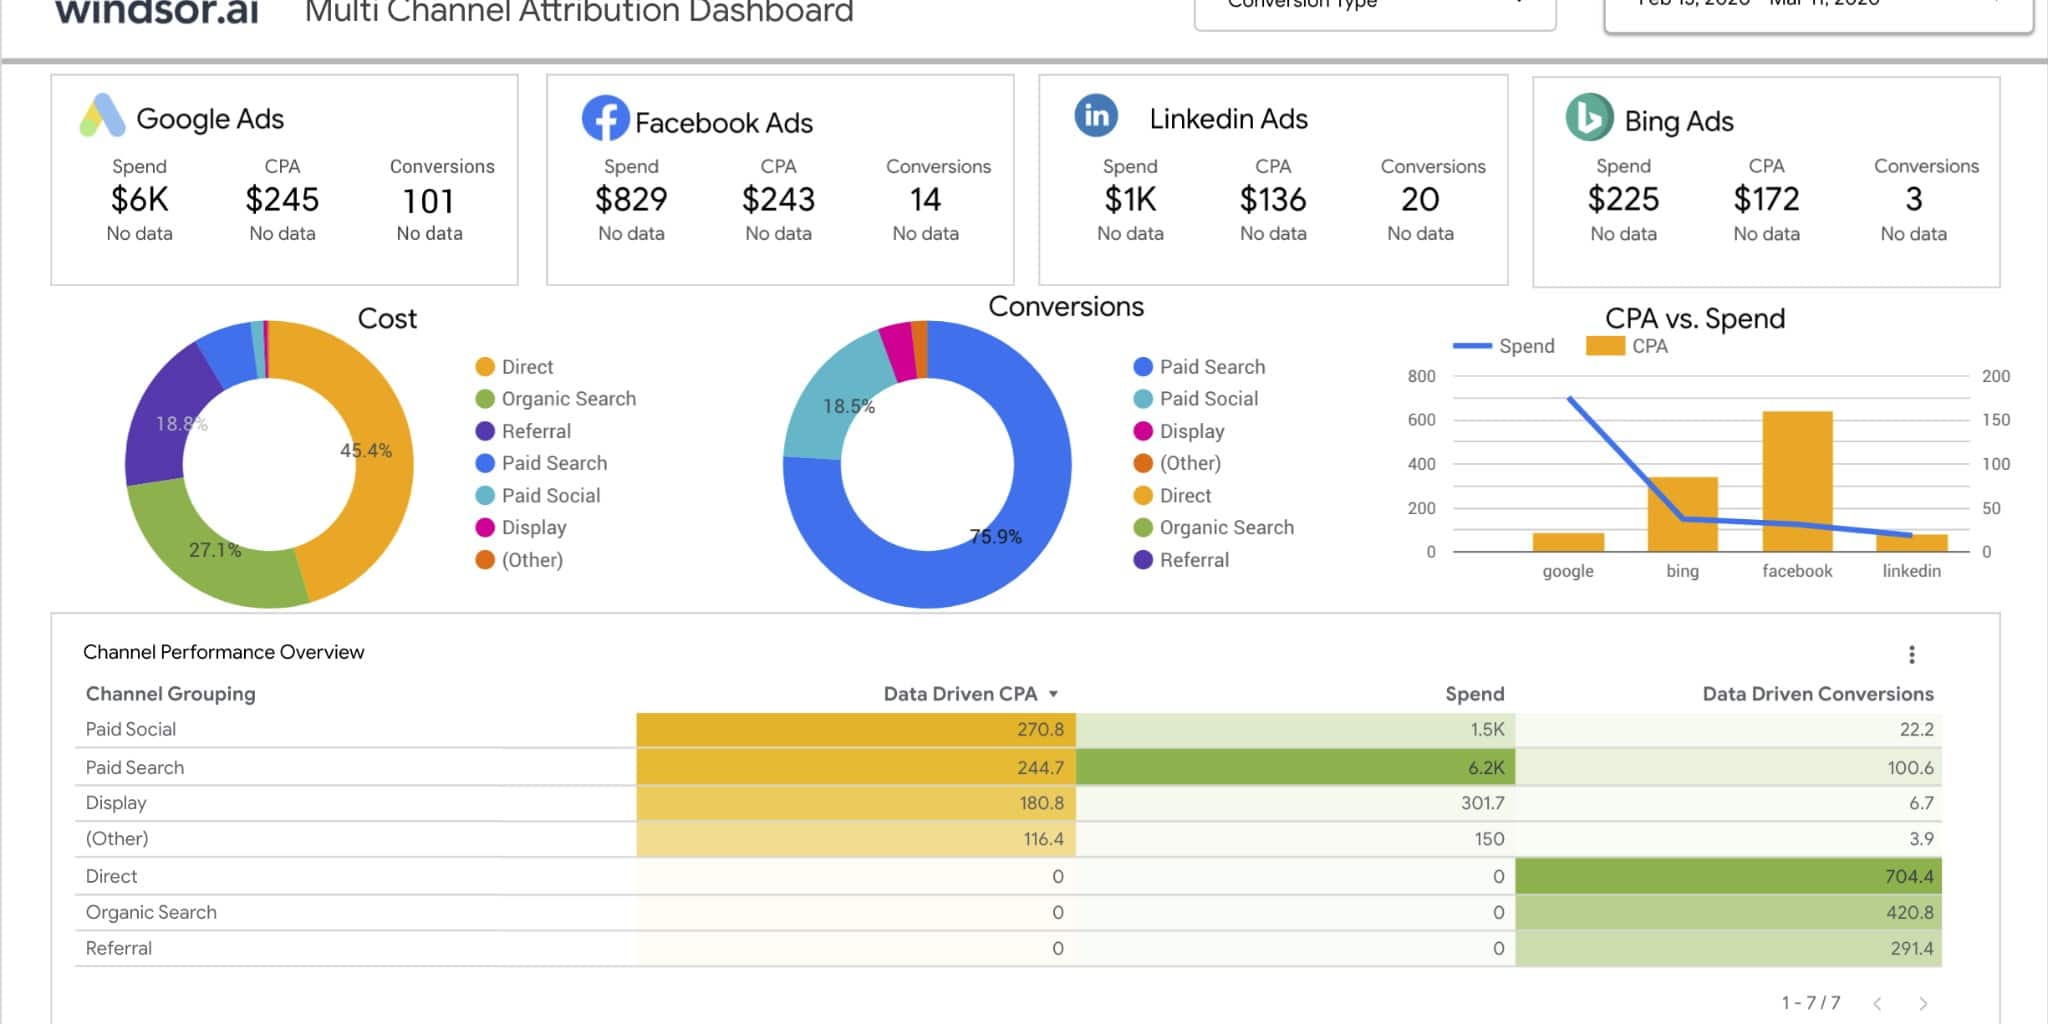
Google Data Studio is one of the best tools for predicting online advertising efficiency and optimizing advertising costs. This tool allows you to collect data related to your ads from various sources such as Google Ads, Google Analytics, and others and visualize them as understandable and visible reports.
To predict the effectiveness of online advertising using Google Data Studio, you can use various tools such as graphs and dynamic reports. Using these tools, you can identify user behavior patterns and check the changes in user behavior. In addition, you can use data analysis to find the best solutions to optimize your advertising costs.
For example, you can generate reports on your ad conversion rates, spending, and revenue using Google Data Studio. By analyzing this data, you can find the best way to use your advertising budget to achieve greater efficiency.
Overall, this tool is handy for predicting the efficiency of online advertising and optimizing advertising costs. It will help you find the best strategy for your online advertising.
Google Data Studio vs. Which Tableau is Better?
Both Google Data Studio and Tableau are powerful tools for analyzing business data. Still, I think each has advantages and disadvantages, and depending on your business needs and circumstances, one of them will suit you better.
Google Data Studio is a free tool by Google, and you can easily design your reports and dashboards using it. This tool allows you to access the data collected in the Google space in most cases and analyze them in the form of words.
Google Data Studio also allows you to analyze continuously updated data in real time with the ability to generate automated reports. Also, this tool is integrated with some other Google tools, such as Google Analytics, Google Ads, and Google Sheets.
On the other hand, Tableau is a relatively more powerful version of a data analysis tool that offers various capabilities. Tableau allows you to access data stored elsewhere, such as SQL Server and Oracle databases, and analyze them in reports. Tableau also provides tools for raw data analysis, graphic interaction, and team collaboration in report design.
Since both are powerful tools, the best way to determine is to familiarize yourself with both and test them for your needs. Ultimately, one will be more suitable for you and help you achieve the best result.
Conclusion
As a result, using Goal Data Studio to collect, analyze and display data has many advantages that can be useful for companies and organizations. This tool is free and allows you to collaborate and share your data with others.