


What Is The Relative Strength Index (RSI) And What Does It Do?
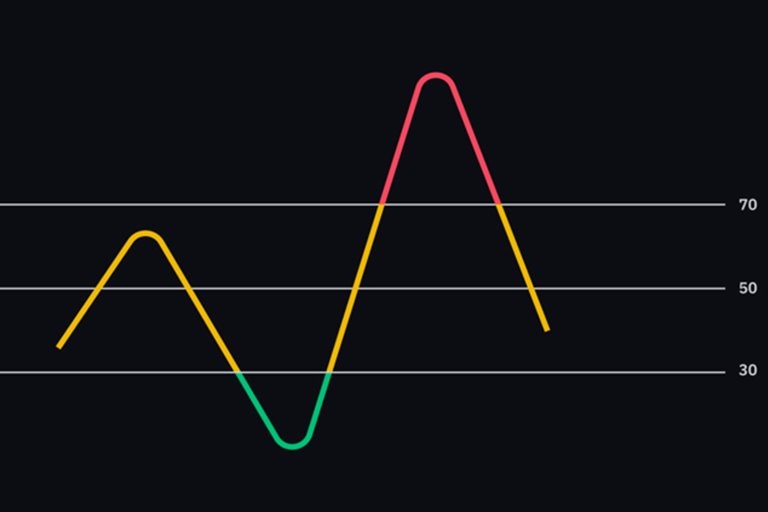
The Relative Strength Index (RSI) Is One Of The Technical Analysis Tools That Shows A Number Between Zero And One Hundred.
In this index, the number seventy or more can be considered a signal for sale, and the number thirty or less can be considered a buy signal.
In the stock market and digital currencies, there are two types of approaches to market analysis: Fundamental analysis; 2. Technical analysis. Fundamental analysis is more difficult and time-consuming than technical analysis; For this reason, many people prefer to use the second approach.
In technical analysis, the market’s future can be predicted by following the price trend and using various tools. One of these tools used to detect the downward and upward trend of the market is called the relative strength index (RSI).
The titles you will read in this article
- What is the Relative Strength Index (RSI)?
- Calculate Relative Strength Index (RSI)
- Relative Power Index (RSI) Performance
- Interpretation of Relative Power Index (RSI) ranges
- Use of divergence signal in relative strength index (RSI)
- Use of oscillation rejection signal in relative strength index (RSI)
- Relative Strength Index (RSI) Limitations
- Relative Power Index (RSI) Buy Signal
What is the Relative Strength Index (RSI)?
J. Welles Wilder introduced the Relative Strength Index (RSI) in the late 1970s. This index is basically a technical analysis tool that measures the amount and speed of price fluctuations. The value of this index varies between zero and one hundred. Its performance can explain in one sentence: Relative strength index increases with increasing number and volume of positive closed positions and decreases with increasing positions at a loss.
- In this index, the number seventy or more indicates the extreme purchase or overstatement of an asset and is likely to lead to a change in trend or price reduction to reform the market.
- In this index, the number thirty or more indicates extreme sales or undervaluation of the asset and can indicate the right time to buy.
Calculate Relative Strength Index (RSI)
The average profit or loss figure used to calculate this index is the average percentage of profit or loss during a review period. In this equation, the average digit loss is considered positive. The standard interval used for the first review period is fourteen-day periods.
- The first average profit = the sum of profits in a period of 14 days / 14.
- The first average loss = the sum of losses in a period of 14 days / 14.
The second and subsequent calculations of these numbers are based on the previous profit and loss averages:
- Average profit = [(previous average profit) * 13 + current profit] / 14.
- Average loss = [(previous average loss) * 13 + current loss] / 14.
In the second calculation, adding the previous average to the current value is a way to smooth the chart. This method is also used to measure the moving average (EMA). The more days of the review period, the more accurately the relative strength index is calculated.
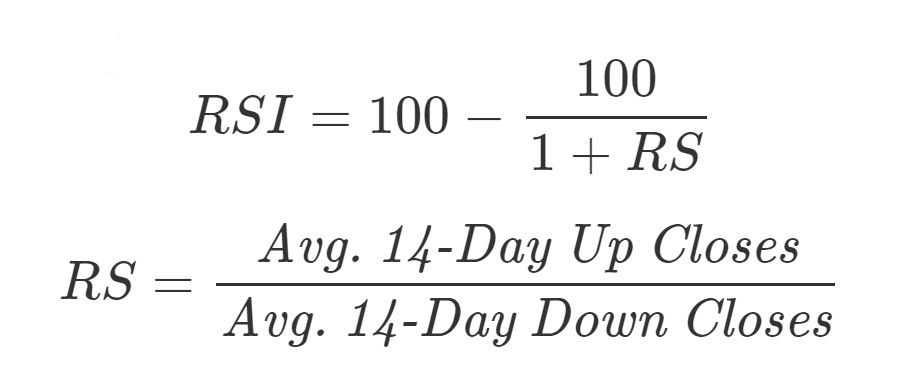
- Relative strength index = 100 – [100 / (1 + (average profit / average loss))]
Using the above formula, the relative power index is calculated. The index can be seen below the price chart of digital currencies:
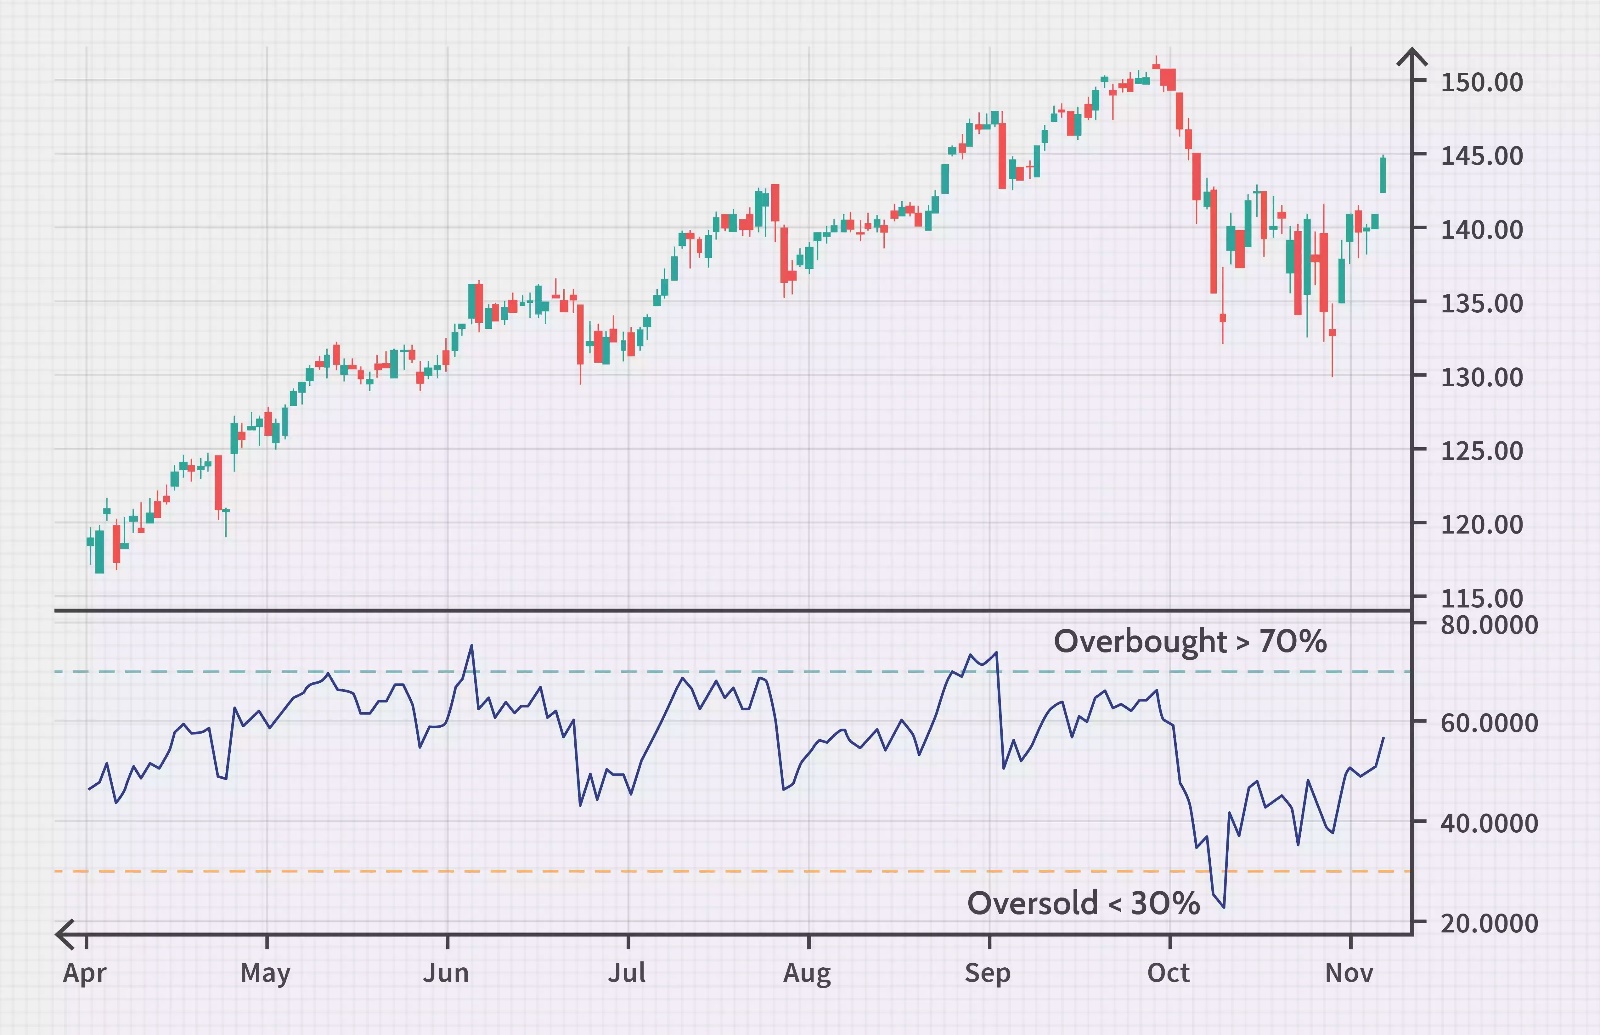
Relative Power Index (RSI) Performance
The relative strength index shows a number between zero and thirty sales saturation and between seventy to one hundred market saturation. However, this contract can be adjusted differently depending on the settings of this index for each user and the strength of the market trend, if necessary. For example, some use a combination of 33-66 instead of 30-70, and some use a combination of 20-80. If the relative strength index value shows a digit between the numbers thirty and seventy, we consider that region a neutral and neutral range.
Interpretation of Relative Strength Index (RSI)
By examining the performance of the relative strength index, it is possible to detect the possibility of reversing the market trend: if the market trend is upward; But the relative strength index, after a few strokes with the number seventy (any other contract number for the extreme buy limit), can not break it and then fall below thirty (any other contract number for the extreme buy limit), it can predict that The end of the uptrend is near and we will soon see the market reverse.
The same is true of the opposite: if in a downtrend the relative strength index fails to break the threshold after several strikes at thirty and moves towards seventy, we find that the downtrend is probably weakening and may soon be. Let’s see the price reversal. The relative strength index will approach zero or one hundred only in a market with a strong trend, whether bullish or bearish.
In the bull market ( bull ), Relative Strength Index between the range of forty to the ninety-stay area as much as forty to fifty Low Price (backup) is considered.
In the bearish market ( bear ), the Relative Strength Index tends to stay between ten and sixty and fifty to sixty regions known as resistance levels.
If the base price changes without predicting the relative strength index, it can be interpreted as changing market trends.
In strong trends, the relative strength index may remain in the extreme buy or sell range for a long time.
While these two issues may seem a bit confusing to new users in market analysis, learning to use and interpret the numbers correctly at the right time can be a great guide to help you decide when to buy or sell. Help in the market.
Use of divergence signal in relative strength index (RSI)
Divergence in technical analysis occurs when the value of an asset moves in the opposite direction of the target index.
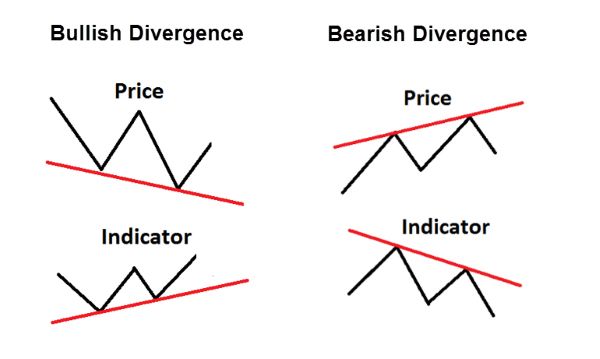
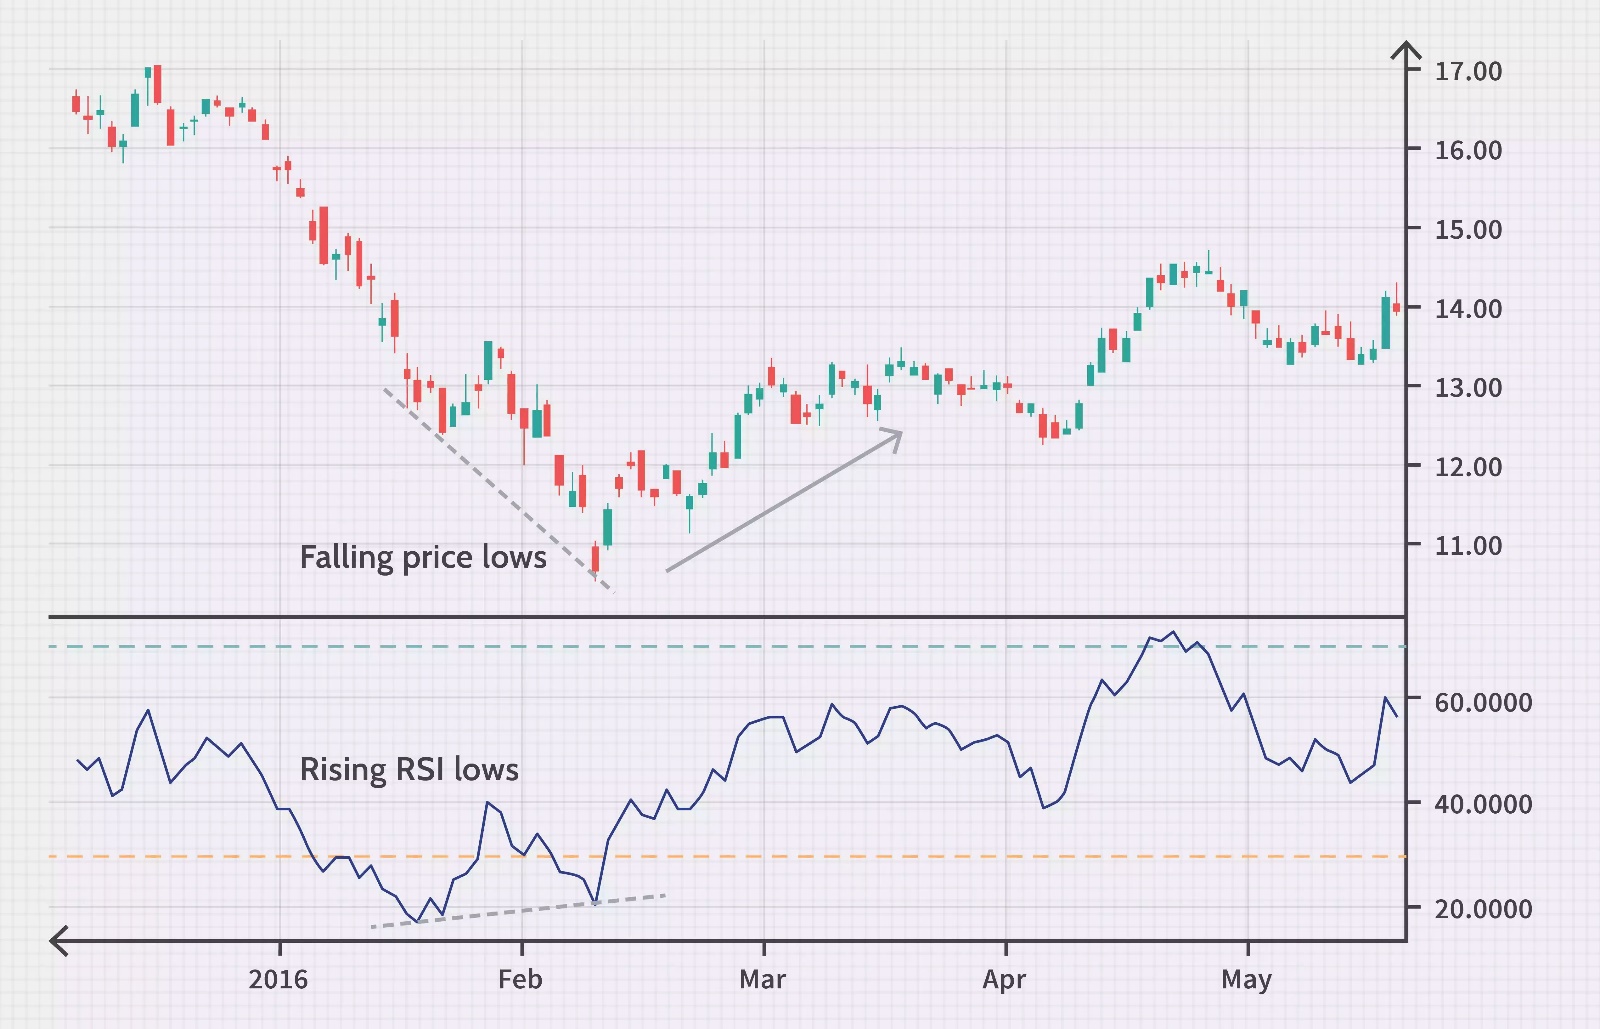
Divergence occurs when the peaks created in the relative strength and price index are higher or lower than their previous peaks. When we see this happening, we can assume that the current trend is weakening and may change the direction of the price. Divergence has two types, ascending and descending:
An upward divergence occurs when the relative strength index shows extreme sales and the price is rising simultaneously. In this case, it can understand that market fluctuations are high, and the time to buy is appropriate.
A downward divergence occurs when the relative strength index indicates an oversupply in the market, and we see a price increase at the same time. A divergent bullish market can also use to find a potential selling point. Divergence rarely occurs in long-term processes and does not apply to powerful and sharp processes.
Use of oscillation rejection signal in relative strength index (RSI)
Approaching the relative strength index to the lower level of support (Support Level) or resistance level (Resistance Level) and moving away from it again without rejecting it is called the oscillation rejection method. Oscillation rejection has two types of cows and bears:
Reject cow swing
When the relative strength index approaches the lower limit set for the price (Support Level); But without crossing this line, it moves in the opposite direction:
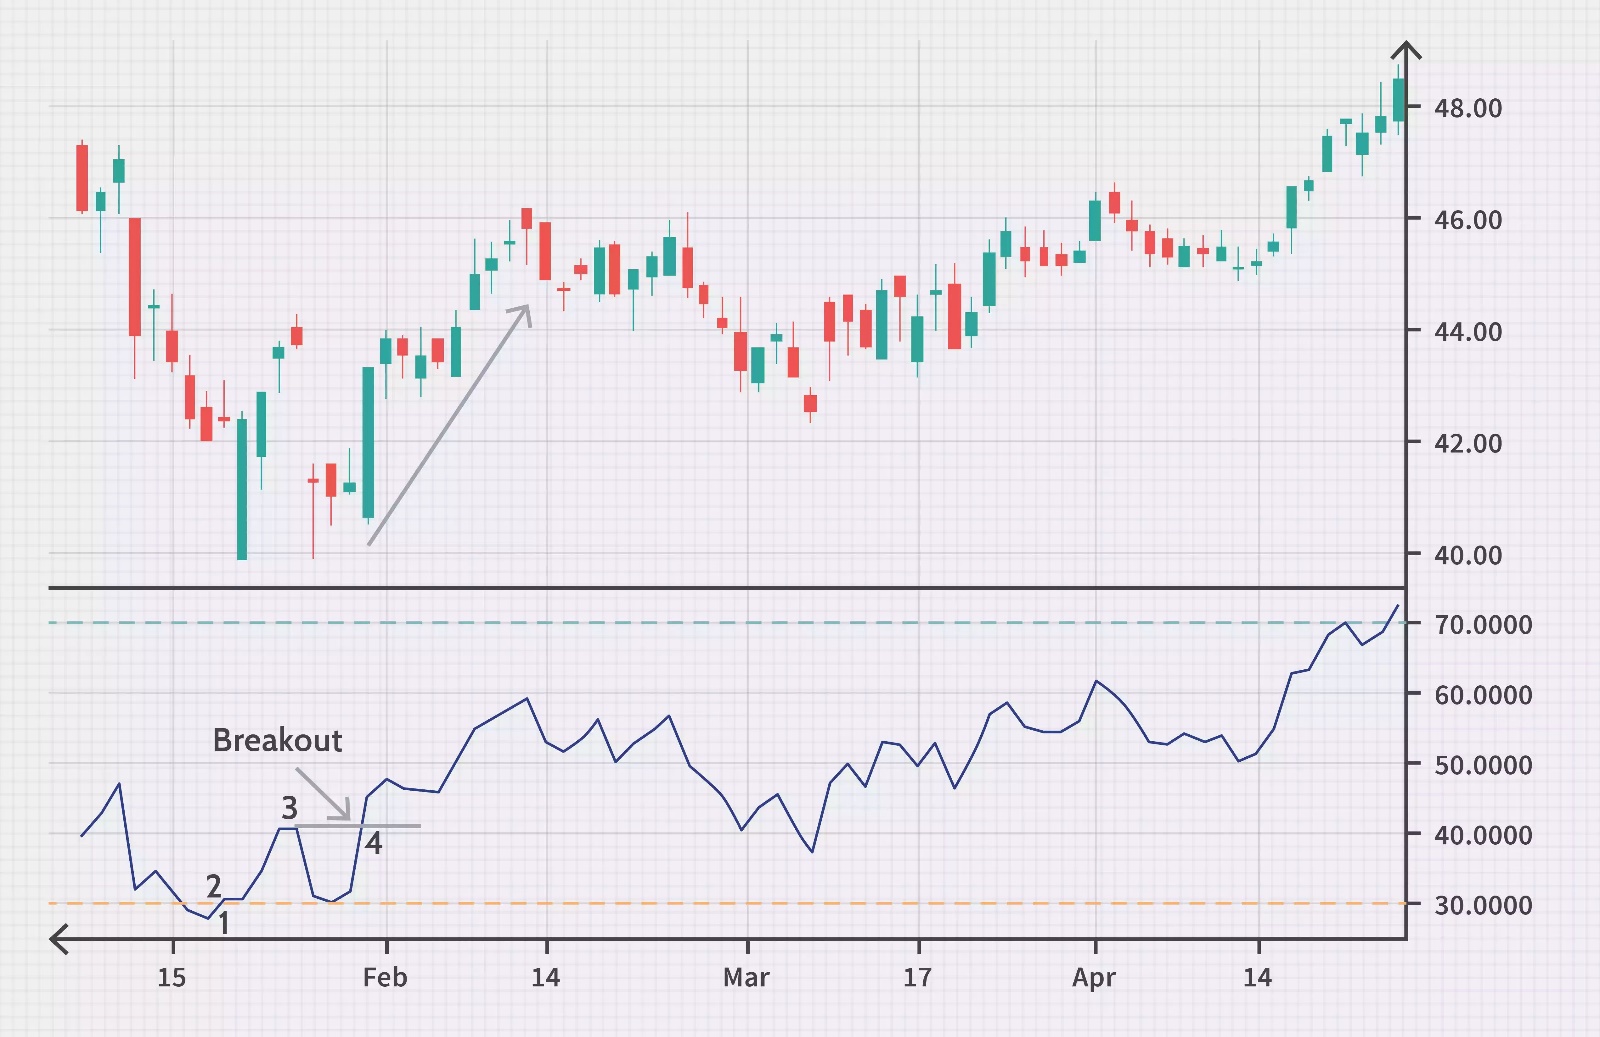
- The RSI enters the oversold area.
- The RSI is above the C (lower price range).
- RSI returns to level C, But it does not cut it.
- The RSI breaks its previous high and goes higher.
Reject the bear swing
When the relative strength index approaches the upper limit set for the price (Resistance Level); But without rejecting this limit, it moves in the opposite direction again:
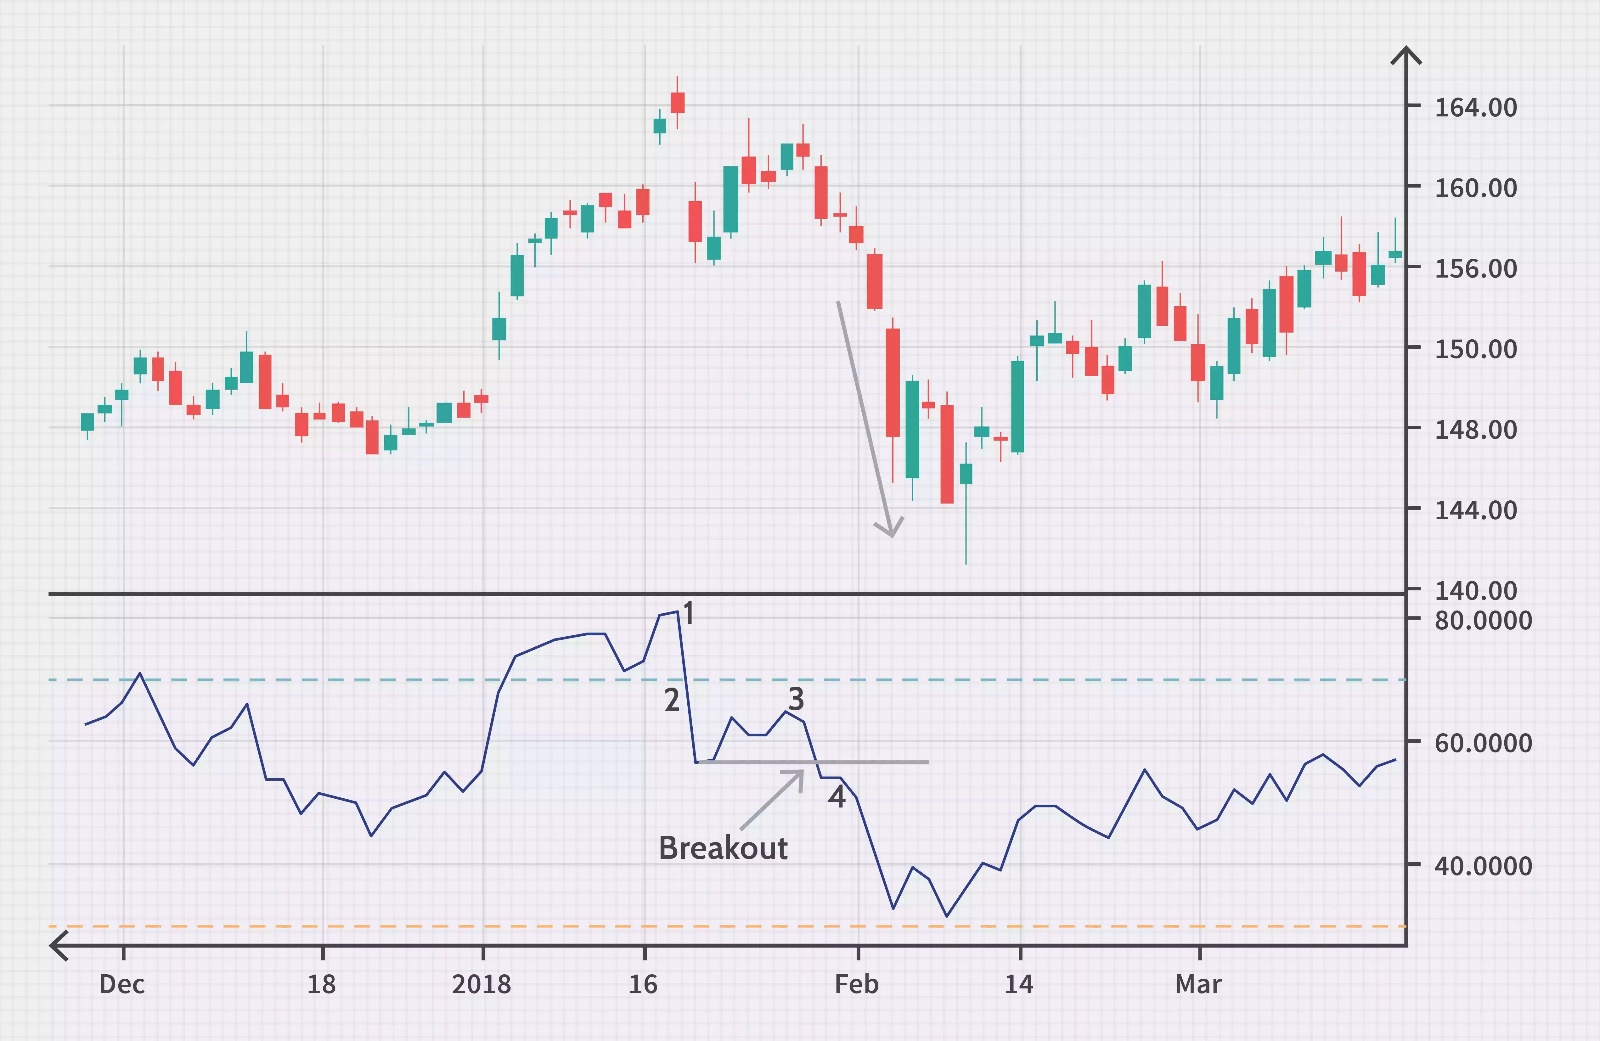
- The RSI enters the extreme buying zone.
- The RSI is below the resistance level (number seventy).
- The RSI is approaching 70, But it does not enter the range of seventy to one hundred.
- The RSI rejects its previous lowest value and goes lower.
Rejection of oscillation in long-term processes gives a more reliable signal to the user.
Relative Strength Index (RSI) Limitations
The Relative Strength Index compares the uptrend and downtrend of the price and shows the result in a fluctuating graph below the price chart. Like many technical indicators, relative strength indicators are more reliable while long-term market trends are.
Although this indicator rarely signals a reversal of the market, it is difficult to distinguish them from false warnings:
- False Positive: When the relative strength index with an upward movement exceeds seventy (buy saturation); But do not buy in the market.
- False-negative: the relative strength index is low (number C) with a downward trend, But the price will rise.
Because this index shows fluctuations in the market, significant fluctuations in both uptrends and downtrends can indicate extreme buy or sell for a long time. Therefore, the relative strength index is most used in the volatile market with alternating uptrends and downtrends.
Relative Power Index (RSI) Buy Signal
Many see the rejection of the low C in the relative strength index as a sign to buy, But it depends a lot on the current situation of price changes. For example, sales may continue for some time as prices decline. In this case, users may have to wait for more signals to be confirmed.
It should note that using any technical analysis tool alone is not enough, and one tool should not be relied on to make a decision. Combining the relative strength index with other indicators can provide more reliable signals to users.
Have you ever experienced using the relative strength index? What other indicators do you know that you can use in a technical market analysis?
***