What is the Ichimoku Cloud; Training in use in technical analysis
To be in digital currencies successful in investing or many other financial markets such as the stock market and Forex. We need to be with the science of technical analysis familiar. Then join us to learn one of the tools used in a technical analysis called the Ichimoku cloud.
The Ichimoku cloud is a method for technical analysis that integrates several indicators into a single chart. This process is used in candlestick charts as a trading or trading instrument that gives us an excellent belief of the support and resistance areas of the price.
This tool is also used for forecasting, and many traders use it. To determine the direction of the future trend and market movement.
The concept of the Ichimoku cloud was first coined in the late 1930s by a Japanese journalist named Guichi Hosada. But his creative trading strategy was introduced in 1969, after decades of technical study and development.
Hosada named its creative tool Ichimoku Kinko, which means “balance chart at a glance” in Japanese.
How does it work?
The Ichimoku cloud system shows information based on forwarding and backward indicators, and its chart consists of 5 lines:
- trend line Tenkan-sen: 9-period moving average (blue line)
- Standard Line or Kijun-sen (Kijun-sen): Moving average of 26 periods
- A leading line or Snkv Aspen (Senkou Span A): moving average and trend line standard line is as much as 26 courses to the right, which has been carried forward.
- Aspen Snkv leading line or wireless (Senkou Span B): Moving Average 52 periods by as much as 26 candles transition period to the right (forward) are attained.
- Delay Line or Chikou Span: Closing price in the last 26 periods.
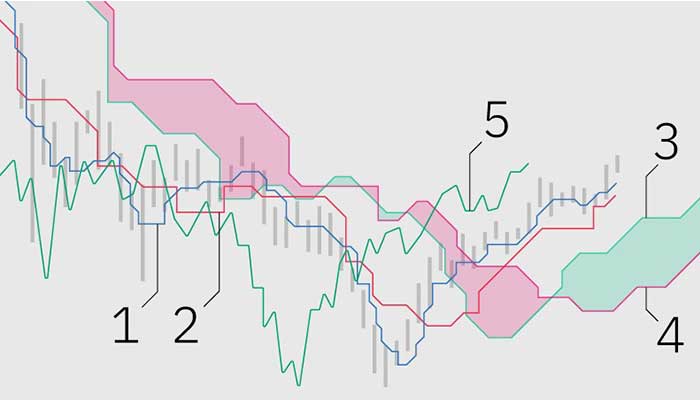
The space between the forward line A and the forward line B produces the Como cloud, which seems to be the essential part of the Ichimoku system. These two lines deliver a future forecast by shifting 26 cycles forward. This is why they are considered as leading indicators.
Chico span is a regression indicator achieved by moving 26 cycles left or back.
By default, these clouds are shown in green and red to make them easier to read.
A green cloud is formed when the forward line A (green cloud line) is above the forward line B (the red cloud line).
Naturally, if the situation is the negative of what has been said, a red cloud will form.
It should be noted that, unlike other methods, the moving averages used by the Ichimoku strategy do not work based on the closing price of the candles. Instead, they are calculated based on the highest and lowest points recorded in a given period (high-low average).
For example, the standard equation for a 9-day trend change line is as follows:
2 / (maximum amount recorded in the nine days + minimum amount recorded in the nine days) = thin age line
Read this article about bitcoin
Ichimoku settings
After three decades of analysis and experimentation, Guichi Hosada concluded that period settings (9,26,52) work best. At that time, the work schedule in Japan also included Saturdays (only Sundays were closed), so the number 9 was a week. And a half (6 + 3 days). The numbers 26 and 52 also showed one and two months, respectively.
While these settings are still preferred in most trading areas, charts specialists can constantly adjust these numbers to suit different strategies.
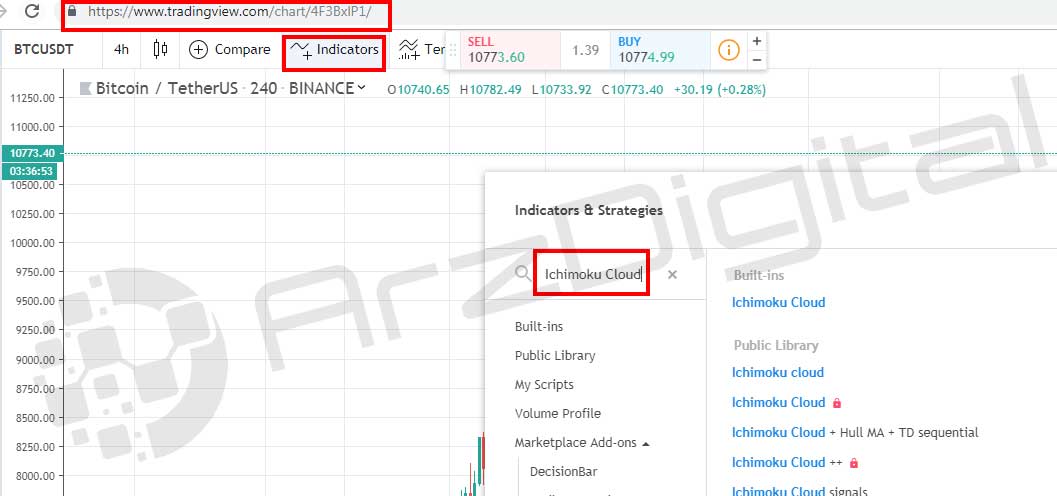
For example, in the digital currency market, many traders adjust the Ichimoku setting to 24.7 (there is no digital currency market. Which is open 24 hours a day, seven days a week) from (9,26,52) to (10,30,60) change. Others go a step further and change the settings to (20,60,120) to reduce incorrect signals.
However, there is still debate about the best possible correction for these settings.
Some argue that it makes sense to change the settings given what is happening in the digital currency market timing. But others say that changing the settings from their original default mode may upset the system balance and cause a lot of invalid signals. Produce.
Chart analysis
Ichimoku Trading Signals
Due to the many elements used in Ichimoku, the Ichimoku cloud produces different signals, divided into trend signals and motion signals.
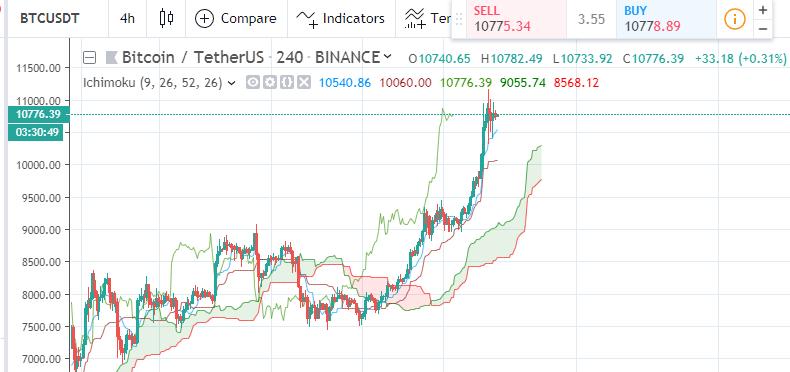
Motion signals are generated according to the association between the market price, the standard line, and the return line.
Upward signals are generated when both return lines and the market price move above the standard line.
Descending signals are generated when the return lines and the market price move below the standard line.
The intersection between the return line (Tonkan Sen) and the standard line (Keijon Sen) is often referred to as a TK cross.
Trend signals: These signals are generated based on the color of the cumulus cloud and the market price class relative to the cloud.
As mentioned, the cloud color represents the difference between the advancing lines A and B slopes.
Put, when prices are repeatedly above the cloud, it is more likely that the asset will be on the rise. Contrarily, when prices are below the cloud, it can signal the beginning of a downtrend.
With a few exceptions, when prices move forward within the cloud, it can signify a flat or unbiased trend.
Chico Span, which is a backward indicator, is another tool. That can help traders and confirm reversal trends. This index gives a good view of the price movement (price action), which can catch an upward trend when this index moves above-market prices or, conversely. A downward trend when this index moves below market prices.
Typically, the delay line is not the only application used in combination with other Ichimoku cloud features.
Conclusion
Motor signals
If the market price moves above the standard line, it is a signal to detect an uptrend. And if it moves below the classic line, it is a guarantee of a downtrend.
TK cross: If the trend line moves above the standard (uptrend) and below the regular (downtrend).
Trends following signals
Market prices move above the Ichimoku cloud (uptrend) and move below the cloud (downtrend).
The cloud color changes from red to green (upward trend) and green to red (downward movement).
A reversal line or a delay above-market prices, an upward and downward trend in market prices, is downward.
Support and resistance levels
Ichimoku diagrams can also be used to specify support and resistance areas. Typically, forward line A (green cloud line) acts as a support line during the uptrend and a resistance line during the downtrend.
In either case, chart candles tend to move closer to the A-line. But if the price moves inside the cloud, the B line may also act as a support/resistance line. In addition, there is the fact that both the A and B front lines, predicting the following 26 periods, will allow traders to anticipate support and resistance areas.
Signal strength
The strength of the signals generated by the Ichimoku cloud strongly depends on whether they are in line with the broader trend. A movement that is part of a more transparent and more significant trend is always more substantial than a signal in the opposite direction of the dominant trend.
In other words, if an uptrend does not accompany an uptrend, that signal may be misleading and inaccurate. Therefore, when a call is generated, its color and position relative to the cloud are essential. Trading volume is also a parameter that must be considered.
It should be noted that the use of Ichimoku in smaller timeframes (charts with less than daily timeframes) leads to the production of incorrect signals. In general, longer timeframes (daily, weekly, monthly) produce more reliable price motions and accurate trend signals.


