Surely you, like me, have heard a lot like doing a dissertation with SPSS or doing an article, or preparing a questionnaire and statistical work and all over the internet.
Yes, in this post we are going to see what SPSS is, to tell you briefly and restrictively what its uses are, and to review the best versions of it together.
Generalities of SPSS
If you have just heard the name of this software or you are curious to see what SPSS is, you have chosen the right place. SPSS, which stands for “Statistical Package for the Social Sciences” or “Statistical Package for the Social Sciences”, is briefly a Windows program or software that receives various information (such as information from a questionnaire). And prepares tables and graphs for them.

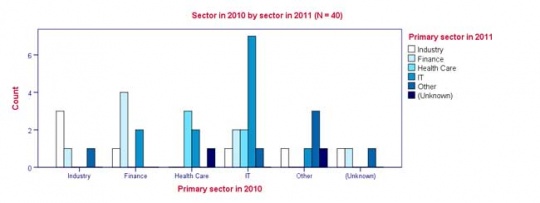
Sample diagram prepared with SPSS
As we read in Persian Wikipedia : The first version of this software was released in 1968 after the founding of “Norman Reed”, who then became a senior political scientist at Stanford University, and now a research professor at Stanford University School of Political Science. He is a retired professor of political science at the University of Chicago.
The software company was acquired by IBM on July 28, 2009, and IBM renamed it PASW, which stands for Predictive Analytics SoftWare. Strangely enough, again in version 19 IBM decided to choose the name SPSS Statistics.
Applications and types of spss
The first use of this software is quite obvious. Various students or researchers use this software to analyze the information of the questionnaires they prepare for them and present it in the form of graphs and tables. In fact, SPSS is one of the most widely used software for statistical analysis in the social sciences.
This software is used by market and trade researchers, health researchers, surveying companies, government, educational researchers, marketing organizations, etc.
Image of the software environment
For example, you are going to do research on women’s satisfaction with the lighting situation in the city. You prepare up to 50 questionnaires from women, with questions that have all the criteria of a standard questionnaire (reliability and validity), then you enter the information into SPSS, in the analysis stage, it tells you what the information in your questionnaire is.
Shows (relative satisfaction, dissatisfaction, etc.) and then, in order to explain it in the form of an article or to other students in simple language, you turn it into a chart or table.
In general, this software has the following applications:
- Prepare statistical summaries such as graphs, tables, statistics, etc.
- Types of mathematical functions such as absolute value, sign function, logarithm, trigonometric functions, and…
- Preparation of custom tables such as frequency tables, cumulative frequency, frequency percentage and…
- Types of statistical distributions include discrete and continuous distributions
- Preparation of various statistical plans
- Performing one-way, two-way, multivariate analysis of variance and analysis of covariance
- Time series analysis techniques
- Creating random and continuous data
- Calculation of various descriptive statistics
- Types of tests related to comparing the mean between two or more independent and dependent communities
- Ability to exchange information with other software
- Processing different types of regression
The main parts of spss
In the following video, you will be briefly taught the main parts and components of the software environment:
Introducing the latest versions and the best version of SPSS
IBM releases a new version of SPSS almost every year or every two years. The common denominator in most versions is that as the version gets newer, the software gets new features but gets heavier. All versions of SPSS do the same thing, with minor and not-so-noticeable differences being added to each new version.
I will share my experiences in training SPSS on the website. Also, if you want to master SPSS within a month, use this educational software .