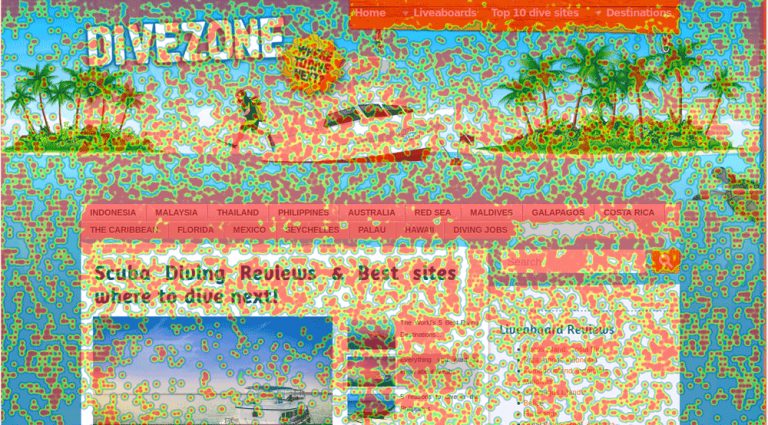
What is Heatmap And How to use it?
HeatMaps are thermal maps of graphic and color data that enable us to identify user behavior. In fact, thermal mapping is one of the usability tests that give us a graphical view of the behavior. And movements of visitors and helps us to orient the product in line with our goals.
Hit Map History
For the first time in 1879, a French researcher discovered that people stop at a part of a word. While reading while passing over another word quickly. Later, a device called the Eye Tracker was develop that monitored eye movements while studying.
In the 1980s, this method was used to survey people’s attention to newspaper and magazine advertisements. Although this cost a lot of money to do. The statistics and information obtained made newspapers and magazines more efficient in advertising by changing their structure and design. Therefore, the use of heat maps became very important and popular.
Is the mouse pointer equivalent to the user’s gaze?
According to a study conducted at Carnegie Mellon University. More than 88% of mouse movements on the pages of a site match the look of the page. Therefore, if we follow the movements and behavior of users on the pages of the site. We will get valuable and useful information and we will have a heatmap to the exact extent.
What is the use of a thermal map for sites?
Keep in mind that the more time you spend gathering information from your site users, the more accurate your site heat map will be. Once your site map is there, you will have a template available. That usually shows yellow and red dots. To get users to pay more attention to those areas.
You should make the most of these points because this data will help you make the right decision in designing and arranging different parts. Put important content or ads in the right places. Once you know which parts of your site get the most attention, deciding to improve your site will be very easy.
Most of the thermal map is useful to place advertisements in better places. An analysis of various sitemaps shows that the top left of the site is one of the best places to place ads. The right side also attracts a lot of attention and is also true for hot maps obtained from mobile phones and tablets.
By checking the heat map, you will find out which part of your site has the highest click-through rate. If you have a store, it is better to put the shopping cart and payment button or special offers there. Identify and modify the less important parts.
The use of thermal maps is not limited to sites. If you are also designing an application, you should pay attention to the heat map and place the more important parts in the points that attract the most attention.
Types of heat maps
In the following, we will introduce you to the types of site thermal maps that you can use to measure the activity and performance of your web page.
Scroll Maps
A scrolling map is a thermal map of a website that visually shows how users scroll down a page, And colors are used to display the most and the least viewed part of a page. Warm colors are seen for popular sections and cool colors for less visible sections. Scroll thermal tracking map is not exclusively for colors. This map gives percentages to let you know how many users have moved to the bottom of the page. An average of one percent is also calculated so you can easily visualize the part of the page that most visitors see before navigating.
Scroll Maps thermal map example
In which pages should we use Scroll Map?
For long and important pages of the site such as the main page of the site and landing screw can be a good choice to create a scroll map; Because with the data that you will get through this application tool, you can make informed decisions about which part of the page to place your most important information.
Heatmap scroll Click
Maps This heatmap tracks where visitors often click. If each section receives more clicks, it is highlighted in red. These include internal links, the site’s halogen menu, CTA images and buttons, and anything that looks clickable. Click Tracking Map Hover Maps This type of heatmap tracks the places where users move the mouse pointer on the screen. Hotspots show the areas where users pause most of the time and place their mouse.
With the help of this thermal map model, it is possible to find out which part of the site is of interest to users and which part is less seen. By analyzing this data, you can place important parts of your site, such as CTA buttons or banner posts.
Tools for creating HeatMap
One of the tools you can use to create a thermal map for your site is the Hotjar site. All you have to do is register on the site and put the code inside your site, and then the site monitoring will begin. The Hotjar site guide provides eight thermal map tests with a solution for each of them, which can be done by the following 3 types of heat maps.


