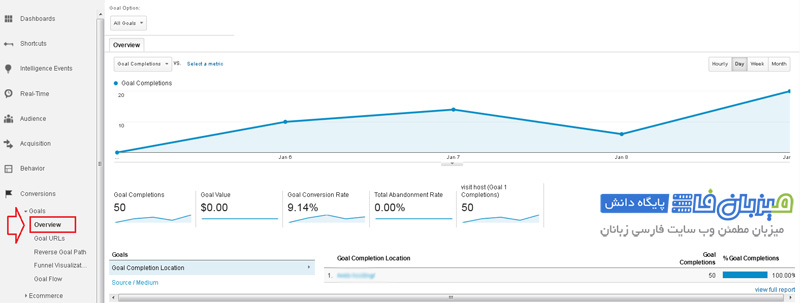
Conversions mean whether the users have done what we want on our site or not. You can get very interesting information in this section. Still, before working with this section, you need to be familiar with creating a Goal and creating your site’s Goals, so please first read the video tutorial on creating a Goal in Google Analytics. From the Conversions section, click on Goals and the Overview sub-set. In Overview, you can see a general statistic of other sub-sections of Goals.

Goal URLs:
In this section, you can see the locations where goals are recorded. In this way, you can see which of your articles performed better and consider these types of posts more.
Reverse Goal Path:
This section reverses the path a user took to score a Goal.
Funnel Visualization و Goal Flow:
The Funnel Visualization and Goal Flow sections will be usable depending on whether you have defined a Funnel for your Goal and only then. Because we did not use Funnel in the goal definition, we will explain a sample image that can be seen below.
This Funnel image is related to an online store that shows the step-by-step purchase steps. The green lines indicate the number of users who have gone to the next steps, and the red lines are the drop-offs or the number of users jumping. Through this section, we can identify the pages that have lost a lot of users, and after checking, we can fix the problems that led to users leaving.
Regarding the Goal Flow section, considering that we had not defined a Funnel for our Goal, we will briefly explain this with an image. In the Goal Flow section, you can also see from which sources the input has come to your site and how much of the total input has reached from Step1 to Step2 and finally to Sales. In these paths, we should not normally return to the previous steps, and for normal websites, this is a problem; why do users return from Step2 to Step1? Of course, this issue can also be normal in some sites according to the design of that site. In this section, we should check and fix the amount of user drops in different stages.
Ecommerce:
It is a Google Analytics feature that you can register products and their prices in Google Analytics and you can get interesting statistics from this section.
Multi-Channel Funnels:
By entering this section, you will see the Conversions chart.
Below the diagram, there is a phrase called Assisted Conversions, which means that, for example, a user entered the website via email and left the site, then a few days later entered the site through a banner, and now if a conversion is done, The email is counted as Assisted Conversion and the banner as Conversion. In fact, an assisted conversion can be considered an auxiliary conversion.
Below this MCF Channel Grouping section, you can see the statistics and also see the overlap of the channels through the pie chart.
Click on the Multi-Channel Funnel>Assisted Conversions option:
In this section, you can see very complete statistics and details of different channels. Assisted/last or direct conversion option also has different values. If the number is equal to 1, it means that as many goals were recorded as assisted, if it is lower than 1, it means that more were entered directly and the conversion was recorded than assisted, and if it is higher than 1 It means that it is assisted rather than last or direct conversion. Last or Direct Conversion means that the user’s last interaction is calculated.
For example, if a user enters the site through a banner and performs a conversion, the banner is considered as the user’s last or direct conversion, and if the user entered through an email before, the email is also considered as an assisted conversion.
To create a new channel in this section, click on Channel Grouping from the top menu of the table and select the Copy MCF Channel Grouping template option to create a copy so that the previous items remain as default and add new items to them. do.
On the Create or Edit Channel Grouping page, click +Define a new Channel.
In this example, we will create a channel for ppc ads in Anetwork, as shown in previous tutorials, to see how many assisted conversions our ads have had.
Therefore, in the Define Rules section, set the Ad content option to Source, set Contains to Anetwork, and finally click Done and Save.
Now a row for ppc has been added to the second MCF table we created, which will also change the statistics of this section over time.
Click on Top Conversion Paths:
In this section, you can see a user’s path to make a conversion. You can even see the number of times and routes in detail. These steps can be many based on whether users trust you easily or enter your website multiple times and in different ways.
Click on Time Lag :
This section displays the number of days until conversion has been completed. For example, what percentage of users converted on the first day and what percentage after, for example, 3 days, etc., which can be effective in the long-term plans of our website