


Online website analysis with history tab in gtmetrix
GT Metrics is a unique tool that you can use to analyze your website online easily. In this online site analysis tool, various information and statistics about the website speed are provided to people. If you can get enough knowledge about them and analyze them properly, you can finally improve the performance of your website from Comment speed improve. The important thing in this regard is that the hosting you provide for your website directly impacts your website’s performance. For example, buying a host for a WordPress site can have a faster website and get more points in gtmetrix. In this article from the Fa host knowledge base, we will look at how to analyze a website with the history tab in gtmetrix. Using this tab, you can view the history of changes to your website in graphic charts and finally analyze it better. If you want to get acquainted with the History tab in Gtmetrix and learn how to analyze a website online using this tab, stay tuned for the rest of this article.
![]() The topics covered in this article are as follows:
The topics covered in this article are as follows:
- Online website analysis using analytical graphs
- How to analyze website performance with the History tab in gtmetrix
Online website analysis using analytical graphs
GT Metrics is a unique analytics tool that allows users to evaluate and improve their website according to search engine metrics. These metrics help users better assess their website’s status in terms of speed. One of the sections of GTMetrix that you can use to get a good understanding of the condition of different website pages through analytics charts is the history tab in gtmetrix.
After an online website analysis in this tab, all the relevant criteria and changes are displayed in an analytical chart. This allows you to visually observe the changes in the various pages of your website and ultimately examine and analyze them. The ability to select different periods, add notes and download charts as a CSV file are some of the main features you can access after analyzing your website online and through the History tab in Gtmetrix. In the following, we will take a closer look at the charts in the GT Metrics History tab and the information they provide.
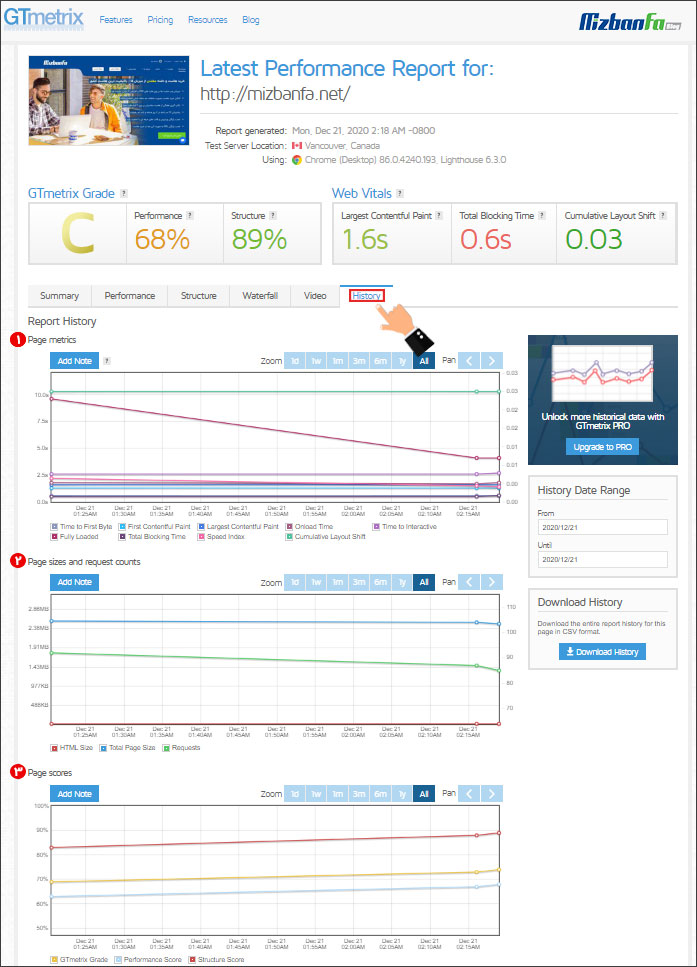
How to analyze website performance with the History tab in gtmetrix
In general, the online analysis reports of the website in the History tab in gtmetrix are divided into three main categories. Each of these reports is presented in the form of an analytical chart through which you can evaluate the performance of your website in terms of speed. The analytics charts on the History page in Gtmetrix are:
- Page Metrics
- Page Sizes and request counts
- Page scores
In the following, we will describe them in detail.
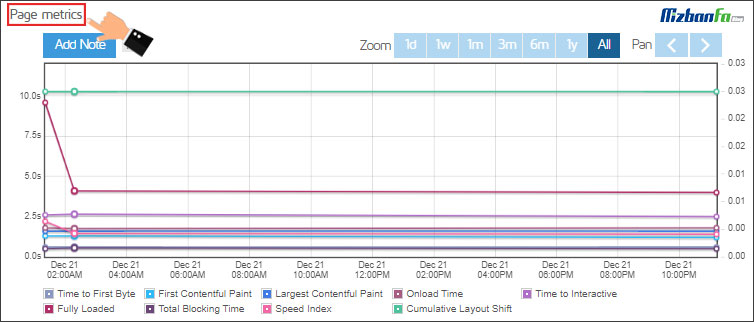
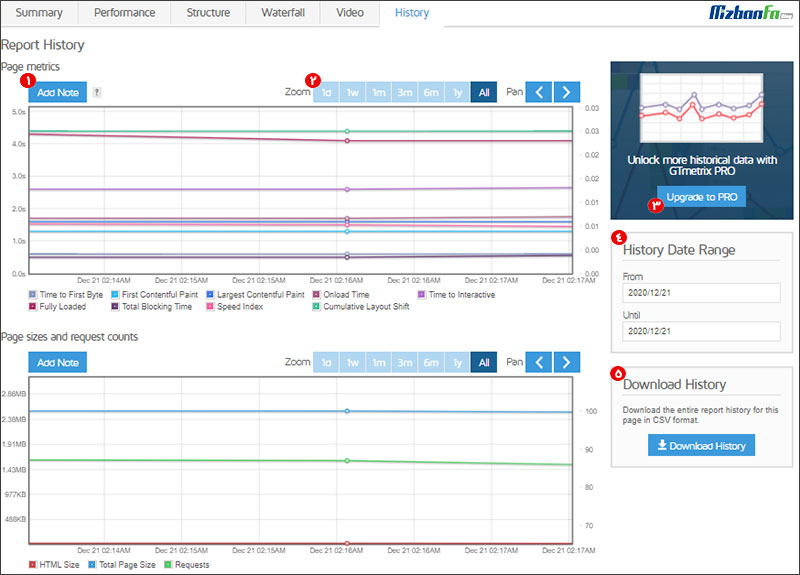
1. Page Metrics chart in GT Metrics History tab
GT Metrics, in collaboration with Lighthouse, sets specific criteria and uses them to analyze websites online. These criteria have unique definitions, and each represents a specific feature in terms of the loading speed of web pages. In this chart, the trend of changes in these criteria in different periods can be seen. At the bottom of the page, it is specified exactly which of the color lines in the analytical chart of the Page Metrics section represents which of the criteria of this website.
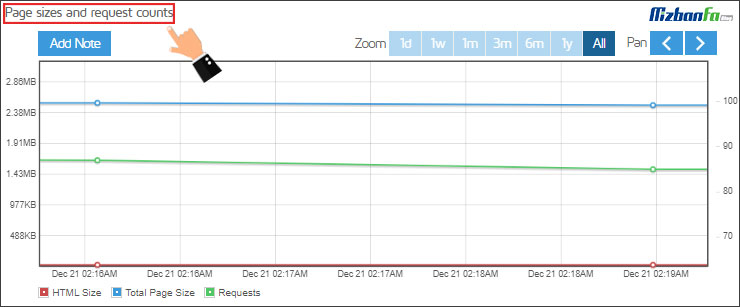
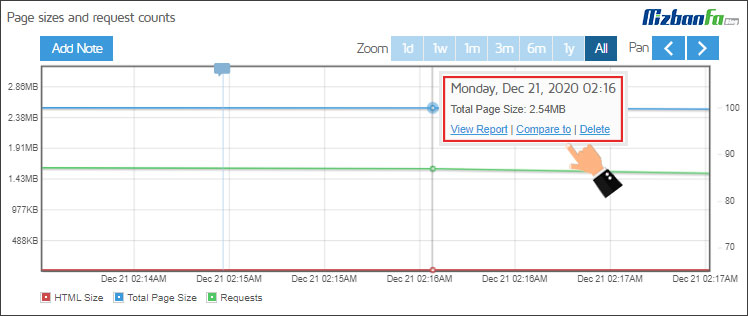
2. Graph of Page Sizes and request counts in the History tab of JT Metrics
The second graph displayed in the History tab in Gtmetrix is a graph of the page sizes and requests. Using this chart, you can take a detailed step in the field of online analysis of your website and realize that:
- How many requests did you have while loading the page?
- How are requests sent to the server?
- What was the overall page size during this process?
- How much have you changed?
- And…
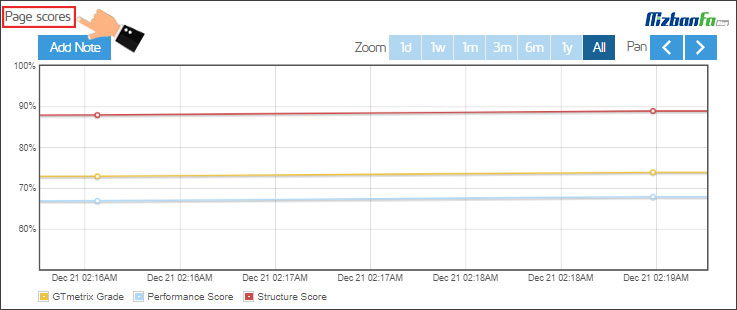
3. Graph Page scores History tab in Gtmetrix
The Page Scores chart is the last chart in the History tab in Gtmetrix. In this section, you can view the score of the reviewed page in terms of performance, structure, and rank received as a graphic chart. This chart visually contains the scores specified in the GTmetrix Grade section, which is visible to the left of all pages.
Note: It is interesting to know that by holding the mouse on the points marked in each of the colored lines in the charts, a box like the one below will be shown to you through which you can view the relevant report ( View Report ), other reports Compare to delete completely.
To analyze the website online in a more efficient way, various capabilities have been provided to users. That’s why being familiar with them will allow you to ultimately improve the performance of your website. Before introducing these features and the role they play in the online analysis of your website, one important point should be noted. Some of these features will only work if you have one of the premium Gtmetrix accounts. In the free version of this online tool, some of these features are locked. If you want to become more familiar with the types of GT Metrix accounts, you can apply through the GTmetrix + registration training article to introduce the types of accounts .
In the following, we will examine the capabilities of the History tab in Gtmetrix and their role in better analyzing your website.
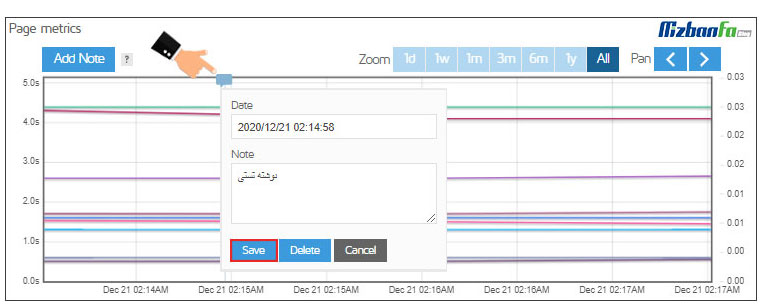
- Add Note : By clicking on this option and then clicking on the chart, you can add a note to any part of the graph you want. After adding a note, a mark is placed on the chart and by clicking on it, you can change the content and time of inserting the note or delete it completely.
- Zoom : Using this section, you can specify that you want the process of changing the desired criteria to be displayed in a certain period of time. This section is active for premium mode, and if you have purchased one of the GT Metrics accounts, you can select one of the default time intervals for online analysis of your website through this section.
- Upgrade to PRO : If you want to be able to further analyze the history of changes to your website in various fields, you need to upgrade your account to one of the premium Gtmetrix accounts. All you have to do is click the Upgrade to PRO button.
- History Date Range : Through this section of the History tab in Gtmetrix, you can specify for which specific period of time you want to analyze your website using the analytical charts in this section. To do this, you must From specify an initial date Until so that the charts are updated according to this date. This section is only active for GT Metrics premium accounts. In free accounts, you can only analyze the website online on the same day