


Learning how to work with the User Flow section in Google Analytics
In this training, we will continue to use the tools of the Audience section and the popular User Flow tool to serve you, the dear audience of the host Fa. Working with the User Flow section in Google Analytics is interesting and amazing. It may seem very complicated and difficult at first glance, but through this tool, you can get very useful information about your website’s audience and the site’s usability. User Flow is a kind of road map of users who entered your website and traveled different paths on your site. Using the graphs in this section, you can find out which routes most of your users have followed and which routes they have left without continuing.
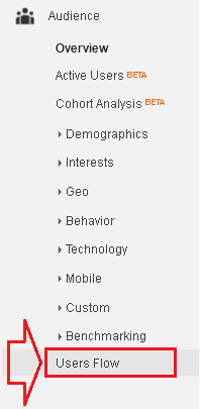
Select the User Flow option from the Audience section to access this tool.
Default by Country displays the chart you see. Which will be explained later on how to change the display based on other values.
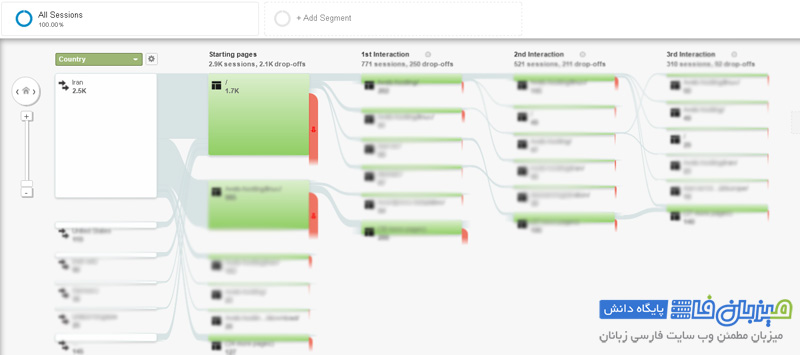
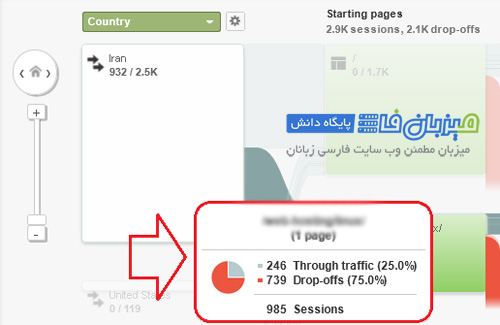
By clicking on one of the paths, you can check in more detail which paths or other pages of your site the users have reached from this path and finally where they have reached. In these graphs, the red parts are user drop-offs or leaving pages by users, you can see detailed information by holding the mouse over each part, and the green parts are the amount of traffic. has been For example, if our users went from the main page to the web hosting page and from there to the European web hosting page and had few drop-offs, it means that this page is the user’s choice and we can even change it for the convenience of the users. Turn these several steps into one step and add European web hosting directly to the navigation section of your site. This item increases the Usability of the site and facilitates reaching the users’ needs.
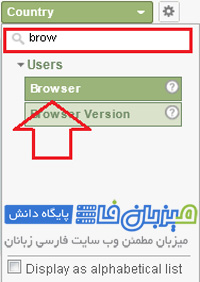
As mentioned before, these graphs are displayed based on the country, and if you want it to be displayed with other parameters, for example Browser, click on the drop-down list specified in the image, so that other options appear. Then, in the Search bar, type the desired word, suppose Browser, so that its option can be displayed and select it. It takes some time for the charts to be adjusted and displayed based on the new option.
Well, so far we have been able to find out who our audience is and what paths they took on your website and what topics they were more interested in using the tools of the Audience section. Help us and we can have a site with more suitable facilities for our audience. If you wish Google Analytics, you can also view