


How To Automatically Detect And Highlight Different Data Between Rows In Excel Software
Finding And Highlighting Changes In An Excel File That Contains Tens, Hundreds, Or Thousands Of Different Cells Is Extremely Difficult And Tedious, And In Addition To Taking A Lot Of Time, It Can Be A Human Error, But Did You Know That Software Excel Editor Provides A Built-In Tool For This Action That You Can Use To Detect Changes In Rows, Columns And Cells In General In A Fraction Of A Second And Save Significant Time?
Highlight Different Data Between Rows, This trick, which is possible by pressing just one key, can be beneficial in quickly reviewing Spreadsheet tabs, which we will learn more about how to use in the following.
To do this, first, hold the left mouse click and then select them by dragging on an area of the cells you want.
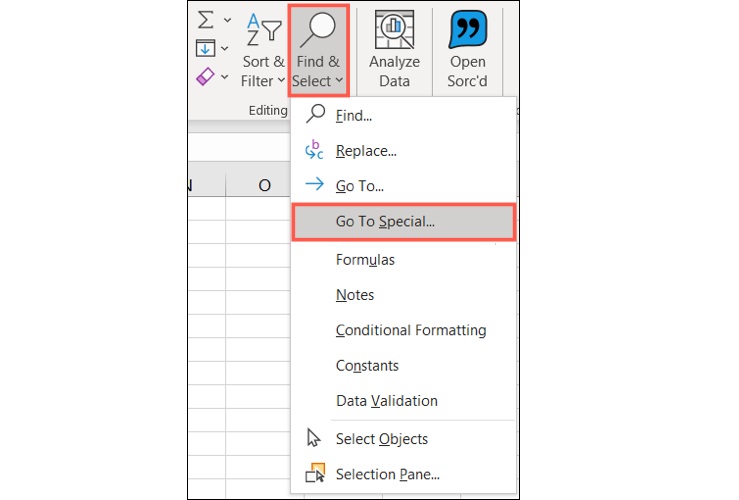
Now go to the Home tab and click on the Find & Select option in the Editing section.
Select the Go To Special option from the shortcut menu displayed to refer to the Special Tools and Settings section.
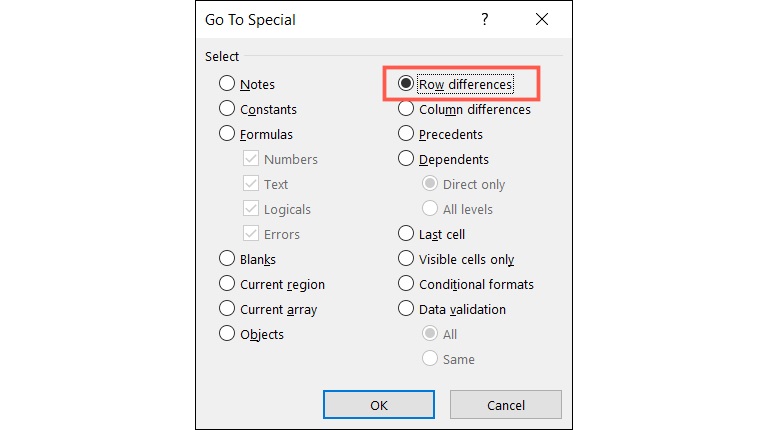
Now it is enough to highlight the differences between the data of the selected cells, first, activate the Row differences option through the newly displayed window and then click on the OK option; You will notice that the special tools window closes automatically and the differences are immediately apparent between the rows and columns. We will now draw your attention to the following points.
It is important to note that the differences in the first cell are determined when using a mouse to select a range of them.
For example, in the image below, as can be seen, cell A1 is referenced by Excel software. It is distinguished from other cells in white by first holding the mouse pointer over the upper left corner of cell A1, and then we drag it to the end of C7 to select the highlighted range. This means that the data in the next cell that is highlighted is actually different from the data in the active column cell.

In the image below, as you can see, the data in cells B4 and C4 are selected, or in other words, highlighted by the software because their value is different from that of cell A4 data. In this screenshot, the reference cell is actually C3, and since the data in it is the same as the A4 data cell, this cell not select.

But in the image below, only cell B5 is highlighted because the data in cells C5 and A5 are the same and are therefore considered identical by the software.

In each row and column, different data with the reference house is detected by the software and then distinguished from the others by highlighting. In addition, different cells with other cells are highlighted in each row, and the differences are notified to the user. The key is that the differences in each row are determined by the reference cell.

Finally, it should be noted that there is no need to rerun the instructions if you want to change the reference cell. First, it is enough to select the desired house by pressing the Tab key and then activating it with the Enter key. ; You will notice that the result changes immediately, and other cells are highlighted according to the reference cell.
The reference cell can be identified and distinguished from other data by drawing a colored border around it.
After the software highlights the data, the relevant cells are selected by Excel software. You can apply simple formatting such as changing the font, font size, bold data, etc., to permanently distinguish them from other items. Then print the sheet and share it with others.