


Full tutorial on how to use GTmetrix
Increasing site speed is the main need of all sites. Because the higher the loading speed of our site, the more attention will be paid to our site by the search engine and we will receive more visits due to giving a high rating. After that, the satisfaction of the visiting user is sought, who tries to click on our site whenever he comes across our site as a result of the search due to the fast loading of the pages. One of the tools that you can use to improve the speed of your site is by fixing GTmetrix errors. In this tutorial, I am trying to teach gtmetrix and fix gtmetrix errors on the site.
Did you know that according to the statistics published by the Aberdeen Group, the following results will follow for every 1 second of delay in the loading of your site pages?
- 11% decrease in site visitors
- 16% decrease in the satisfaction of users who have become your customers
- 7% decrease in site sales statistics
- 50% increase in bounce rate
So we can see that even reducing the page load to less than 1 second has bad effects on our business and if we don’t pay attention to it and don’t consider a solution for this, a lot of damage will be caused to our site, which may need to be compensated. OK, let’s have continuous efforts for years. So, before we cause this problem, it is better to improve the site speed in the first step.
This tutorial, from Hostfa’s knowledge base, will give a complete tutorial on gtmetrix. Using this tutorial, you can see in which areas your site is performing poorly by relying on the statistics and figures you get from your site analysis using gtmetrix. What could be the reason for the slow speed of your site? So, if you are also looking for a complete tutorial on how to use GTmetrix, stay with us until the end of this article.
Complete gtmetrix training and fix gtmetrix errors
The first questions that come to the mind of users to increase the speed of the site are:
- What is the reason for the low speed of the site and the reason for the slowness of our site?
- How to increase site speed?
- What are the tricks to increase site speed?
- To what extent can the use of site speed optimization plugins in content management systems such as WordPress and Joomla positively affect speed?
- And… a lot of questions like this must be stuck in your mind, and you are looking for the best solution to solve the problem of a slow site.
To be able to increase the speed of our site, we must first use the online tools that exist to see what the speed of our site’s pages is like. And when we open a page, what exactly happens when this page is loaded? That is when we enter a page of the site, what is the size of this page and how long does it take for this page to load, and finally, how many requests are sent to the server to load the site?
The best tool to check the speed is the GTmetrix site. Using different browsers and locations on its online software, this site allows you to see the loading speed of your site live and see how many requests, how much volume and How much time is needed? After presenting these items to you, you can see the level of each file and the features that affect the speed increase. For example, can you see how optimal the images used are? Do you know about the browser cache and the impact of using CDN on the site? To what extent are CSS and JS files compressed? Did you compress the site files or not?!
What is the GTmetrix site?
The GTmetrix site, which is available at the address www.GTmetrix.com, allows you to check and analyze the site; using this online tool, you can test the site’s speed in GTmetrix. This site checks all the files that are loaded on one page of the site and based on the parameters it has to optimize the site speed, it gives a score to each of these parameters, and finally, by averaging all these parameters, it gives a score in the form of a percentage for It provides you with site speed based on Google algorithms and site review based on Yahoo algorithms. You will also have other information, such as the optimality of each file on the page, the page review history, etc., based on which you can optimize the site files.
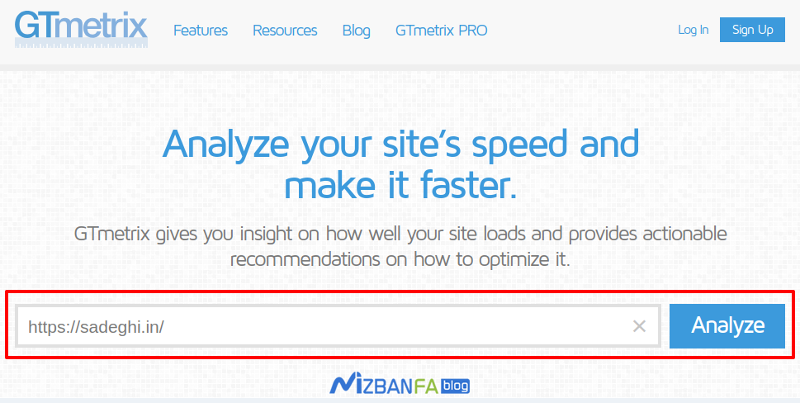
In order to use the GTmetrix site analysis tool, you must first enter this site with the address GTmetrix.com and then enter the site address or page of the site you want to check in the Analyze Performance of field as shown in the image below, and finally click on the Analyze button. click.
Now wait a few moments for your site to start loading in the browser of this online software and check the speed of the site in GT Metrics. If the number of requests is not too high, the site will be fully checked in less than a minute, and when the new page is loaded, the results of the site check will be displayed in GT Metrics as shown below.
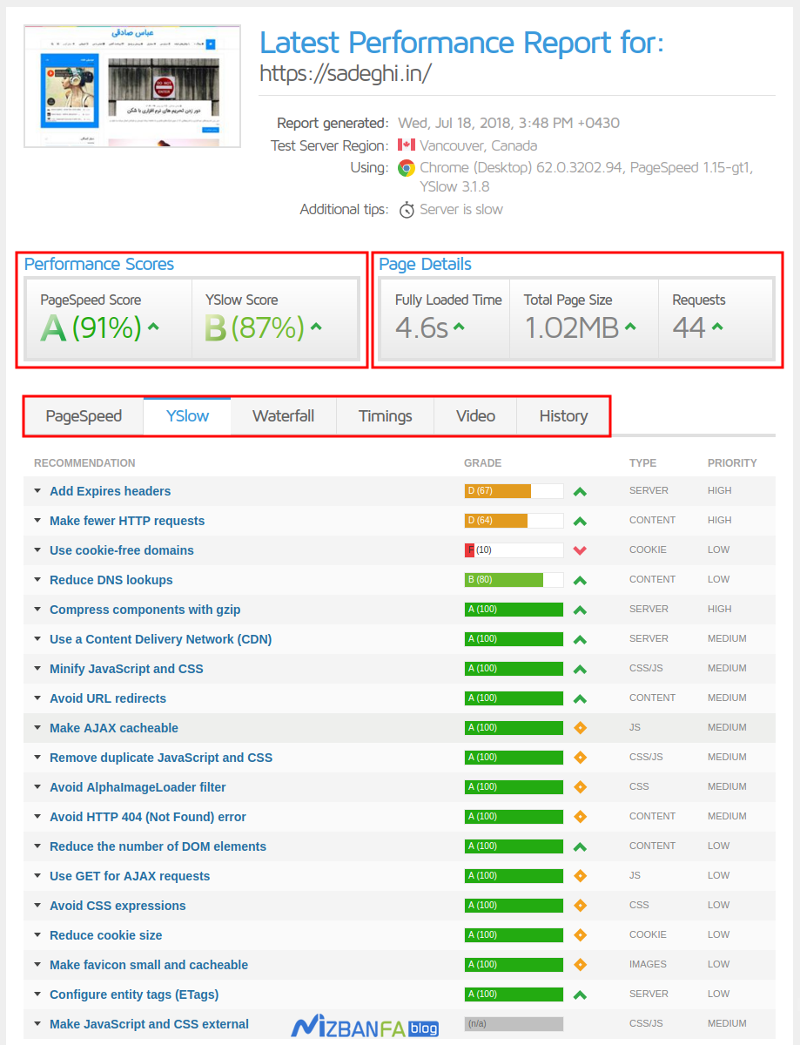
Now, as you can see in the picture, a general score is shown at the top, and at the bottom, the parameters used for the optimality of the site using the site speed test tool with GT Matrix are displayed, based on the color scheme for each of these The parameters are given a score as a percentage, which are as follows:
- Gray: It means that this parameter is not observed on your site and there is no score for it
- Red: It means that the desired parameter exists on the site, but it is not used optimally and the lowest score is given to it.
- Orange: It means that the parameter is respected and exists on your site, but not fully respected
- Pale green means that the desired parameter is met and received an acceptable score, but it can be better.
- Green color: It means that the desired parameter is fully observed and there is no defect in it
Now, as you can see, based on the same parameters specified by color and percentage, an overall score which is the average of these parameters, is displayed at the top of the screen, which is located in the Performance Scores and includes the following two options.
Page Speed Score: This medium is used to show the speed of the site as a percentage based on Google’s algorithms, which show the speed of your site. In this average, there are the same color classifications above, and the higher the percentage, the higher it will be green, and the lower it will be, it will lead to red. Also, this score is classified based on the letters of the English alphabet, from A to F, and based on the final percentage that is specified, one of these letters is displayed, where the letter A means a high score.
YSlow Score: This option is also used to display the average optimality of the site, based on the optimal level of files, and Yahoo’s algorithms are used in this classification. With this classification, you can understand which of your site’s files are the ones that caused the site to slow down, and with the help of this column, you can identify the bulky files that cause the site to load.
On the right side, there is another column called Page Details. In this column, the statistics related to page loading time, page size and the number of requests sent for page loading are shown in order. If I want to explain them, they are as follows.
Fully Loaded Time: From this section, you can see the site’s loading time in seconds. This time starts from the moment the site server responds to the request of the user’s browser to load the page and will continue until all the files are loaded in the user’s browser. In the end, the time it takes to load the site is considered as the amount of time it takes to load the site.
Total Page Size: Based on the parameters set on the site, this option sums up the size of all the files that are loaded and finally shows how much volume and traffic will be consumed for the page you selected, based on MB. is displayed
Requests: Finally, this option will show the number of HTTP requests sent to the server to load the page. and put the files that can be placed together, the site will load faster and better.
Now that you are familiar with each of the parameters of GTmetrix for site speed testing, I will continue to introduce each and the solutions you can use to optimize the site with gtmetrix. Each of these parameters has a detailed topic that you should evaluate in principle on your site and get a high score from each of them.
Training to work with GT metrics and improve site speed
Well, now that you have done the speed test of your site and the results have been shown for each parameter, it’s time to check each parameter and see what exactly it is and then start optimizing it. In the following, I will introduce each of the parameters in the PageSpeed, Yslow, Waterfall, Timings, and History columns, which you can use this complete guide to improve the speed of the site with GTMetrix and to learn how to increase the speed of the WordPress site in GTMetrix. .
Optimizing site pagespeed with gtmetrix
This column is related to the analysis of the site in terms of speed in GTMetrix, which is checked for every parameter that can help the speed of the site, and you will be given the score of this parameter, if any of these parameters is in green, it means It is acceptable. But if the results of the parameters of this column were orange, red or gray, you should improve it.
Optimize the order of styles and scripts: This option is used to optimize the style files and scripts that are permanently entered and used on the site. In this parameter, the optimality of the CSS and JS codes used on the site will be displayed. To improve this parameter, you must first see if you have enough points. If you don’t have a good score, clicking on this parameter will show you the address of the files, which you can optimize by referring to these files