


Digital Currency Analysis Tools That You Must Know Before Investing!
With The Expansion Of The Digital Currency Market And The Increase In Its History, Digital Currency Analysis Tools Have Become Very Popular.
Some of these analytical tools in digital currencies are shared with other financial markets and have many similarities.
For years, technical analysis has become a popular method among traders, analysts, and investors. This analysis has been established for centuries, But in the last 20 years, it has become more popular with the increasing development of data and analysis tools.
In the age of the Internet, more and more people have access to these tools and are using them to shape their trading plans.
Numerous websites and platforms have also been launched to provide, and their popularity is increasing daily. Daily, we will first examine the concept of technical analysis and how it works, and then we will introduce five commonly used digital currency analysis tools.
Finally, we will review three free analysis platforms that provide users with market analysis tools in the best way. So stay with us until the end of this article.
What is technical analysis?
Technical or technical analysis is a tool or method that uses past market data to predict the likely movement of asset prices. Another definition of technical analysis is the art and science of finding entry and exit points in charts for investing and making profits in financial markets.
The theory behind technical analysis is that market traders’ collective buys, and sells can accurately reflect all the information about the traded asset. Therefore, this type of analysis can consistently determine the fair value of investments.
An essential part of technical analysis is devoted to the behavior of traders. Technical research shows that the future fluctuations of the market can be similar to its past changes; Because the collective psychology of participants in different periods is almost the same, and little emotions are inseparable factors of price fluctuations.
Technical analysis focuses on the factors influencing supply and demand on price, volume changes, and fluctuations. This type of analysis is different from fundamental analysis, which focuses on external factors that can affect asset prices. Basic research focuses on macroeconomic factors, financial statements, company performance, and project founders.
Therefore, technical analysts chart market data and use the information on the chart to find trading opportunities. Specialized analysis tools are often used to generate short-term trading signals. Still, when the analysis is done over a more extended period, such as a monthly chart, it can be used for long-term investment.
History of technical analysis
Some sources consider the origin of technical analysis to be the trades of the ancient Assyrian period and the Greek markets. Evidence of the importance of speculation in the period’s work suggests that they probably followed price changes and fluctuations.
However, a more documented indication of technical analysis can be found in the description of Dutch markets in the 17th century by Joseph de la Vega, a diamond merchant, financier, philosopher, and poet living in Amsterdam. He wrote his enduring book, “Confusion of Confusions” in 1688. Focused on general investment advice, this book has become a beacon for tracing the origins of modern technical analysis. In this book, de la Vega explained how he used some techniques to predict the movement of stock prices on the Amsterdam Stock Exchange.
Another early evidence of technical analysis can be seen in Homma Munehisa’s use of candlestick patterns to predict the price of rice in early 18th-century Japan. Huma Munhisa was a wealthy rice merchant from Sakata, Japan. In his book, he described the primary forms of technical patterns and said that market trends and reversals are related to human emotions.
The emergence of technical analysis in the American financial markets
While there is evidence of the use of technical analysis in Amsterdam and London before the 18th century, it was in the late 19th and early 20th centuries that technical analysis was introduced to the US market. This Charles Dow(Charles Dow) was recognized as a pioneer in specialized research in the US stock market. Charles Dow came up with the Dow Theory when he studied the movement of industrial stocks and market transport in 1896.

Dow carefully analyzed the data of the US stock market and published some of his findings in the form of an article in the Wall Street Journal. He published his initial theory called “The Dow Jones Theory.” Charles Dow died in 1902 and could not publish his complete approach, But many of his admirers published his work and conducted further research on his hypotheses in the following century.
What are technical analysis tools, and what are their uses?
Anyone can learn technical analysis using the correct principles and tools and become capable of predicting prices and market changes. izingWe must pay attention to the fact that there are many tools for technical analysis, and learning each requires time and practice. The first and most crucial learning step is familiarizing myself with digital currency analysis tools.
As an investor, you should know the general framework of digital currency technical analysis tools and, in the next step, analyze the charts with the tools you have mastered. Next, by introducing some specialized tools, we present a general picture of them.
Moving Average Convergence Divergence (MACD)
The Makdi index is one of the most popular digital currency analysis tools and a practical and straightforward indicator. As the name of this indicator suggests, Makadi is a type of oscillator because the relationship between the two Moving averages (Moving Orange) shows a price.
In the late 1970s, Gerald Appel, an American physicist and researcher, designed MACD to detect changes in the strength, direction, amount of movement, and duration of a trend in the stock market and subsequently used analysts in other financial needs used it. They did MACD consisting of two MACD lines, a signal line, and a histogram. These components are defined as follows:
- MACD line: 26-day moving average and 12-day moving average
- Signal cable: 9-day exponential moving average of the MACD line
- Histogram: signal line and MACD line
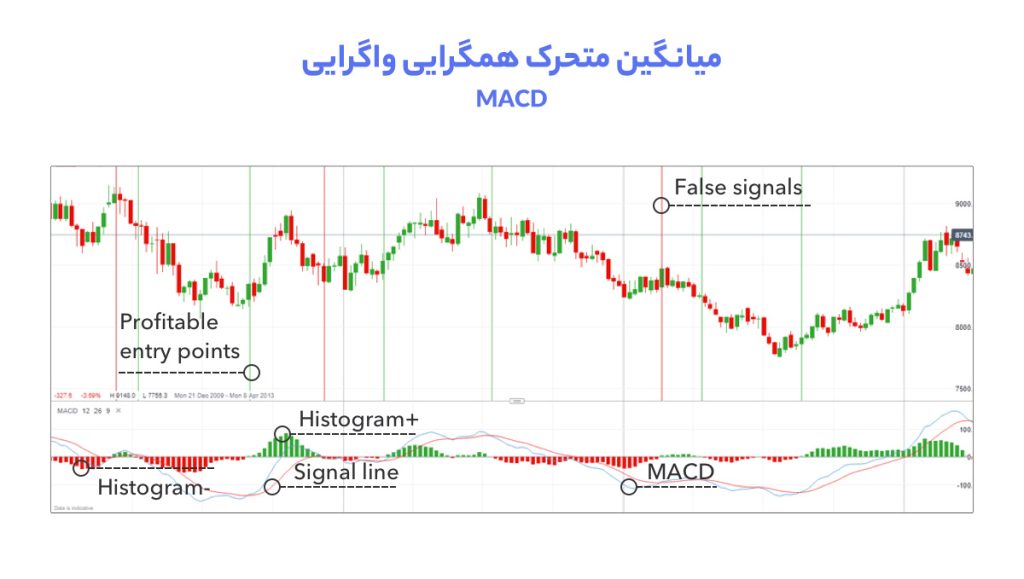
When the 12-period moving average is above the 26-period moving average, the MACD indicator has a positive value; when it goes below it, it has a negative value. The distance between MACD and Base Line indicates the distance between two exponential moving averages.
Relative Strength Index (RSI)
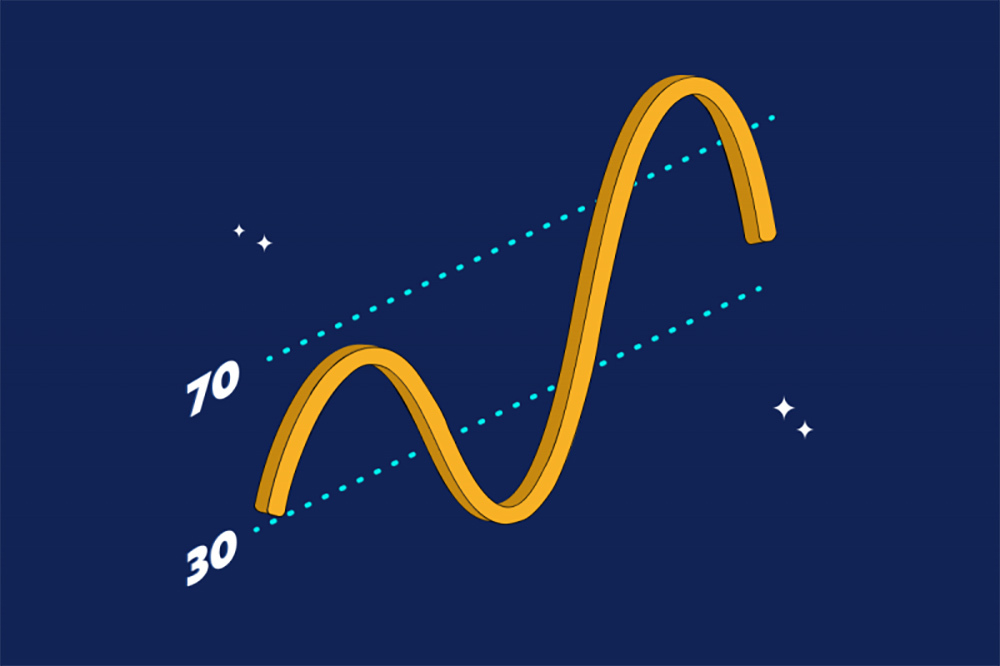
The RSI, or Relative Strength Index, is another popular trading tool that can identify oversold and overbought points by examining market trends. RSI is the momentum indicator or market trend; That is, it checks the speed of price changes.
In 1978, J. Welles Wilder Jr. (J. Welles Wilder Jr.), the father of technical analysis indicators in the trading market, introduced the RSI indicator in the book “New Concepts in Technical Trading Systems.”
If we compare RSI with MACD, we see that MACD uses exponential moving averages; however, the RSI indicator shows a recent price lows and highs chart. However, it is much easier to identify the range market using the MACD indicator. Still, the RSI indicator, as a supplement to the MACD, can show the reversal of the trend by showing oversold and overbought areas.
Examining this indicator’s changes and price changes can help traders correctly identify the trend reversal time and determine the best points to enter and exit the market. However, the RSI indicator, like many other technical analysis indicators, is associated with a high error percentage and sometimes gives a wrong signal.
Balanced Volume Index (OBV)
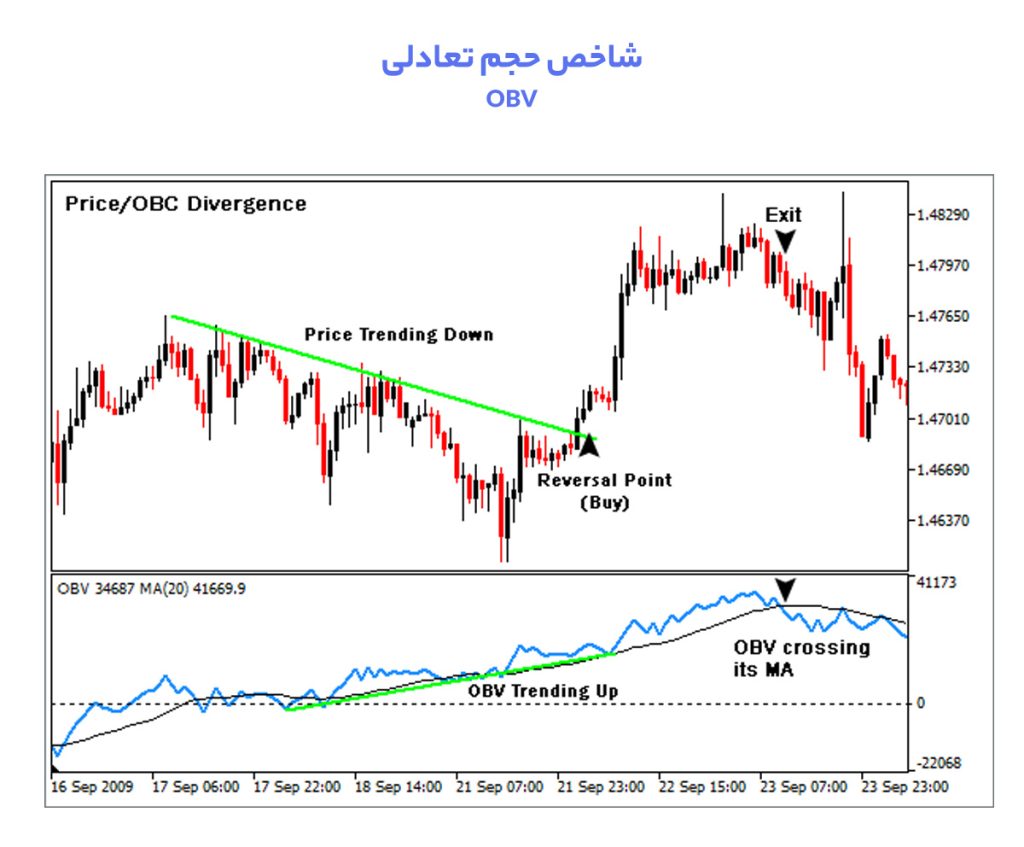
The OBV or On Balance Volume indicator is the balance volume and balanced volume indicator or the volume and price indicator. In 1962, Joseph Granville introduced this indicator in the book “Granville’s New Key to stock market profits.”
A balanced volume index (OBV) measures positive and negative volume flow. According to Granville, volume is the factor that can shake up the market. For this reason, he used this indicator to learn about significant changes in the market based on volume changes.
He saw the indicator’s predictions as a highly compressed spring. When the increase in volume occurs, But if we don’t see any significant changes in the share, eventually, this spring will come out of compression and pull the price up or down with it.
 OBV
OBV
According to Charles Dow’s volume theory, the volume should move toward the trend. In an upward trend, the importance of transactions should increase along with the price growth; in a downward trend, the importance of transactions should improve with a decrease in prices. So in both cases, we should see volume increase, and volume growth confirms the quality of the related trend.
A simple index with essential information
The OBV indicator, which is all about trading volume, is calculated so that if the candle closes, the corresponding volume is subtracted from the total volume. The trading volume is added to this index if the candle closes up. This indicator, while being simple, provides essential information to the trader.
This indicator, which shows the cumulative volume of transactions, is used to determine and confirm the trend. For example, when the price chart and OBV show a downtrend (i.e., candles that closed in a bearish direction have more volume than candles that closed in an upward trend), we can give the probability that the downtrend will continue.
Do not forget that it is possible to observe divergence in this indicator; So that you can determine the strength of the trend and the probability of the return of the movement with OBV.
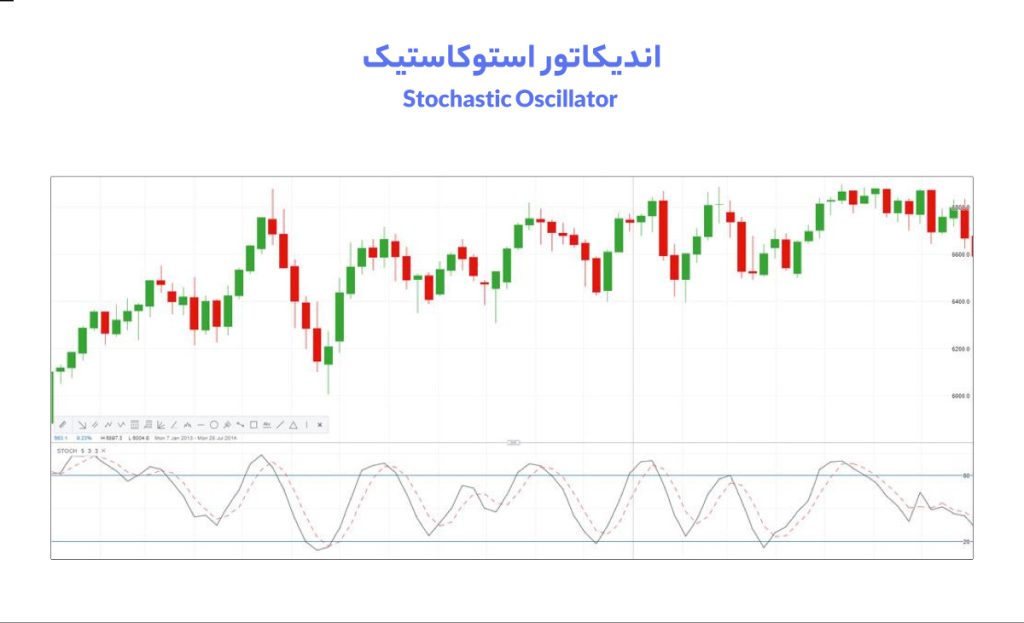
Stochastic Oscillator
A stochastic Oscillator is an indicator that measures the current price according to the price range in multiple periods. Unlike indicators such as MACD and RSI, which directly relate to stock price and trading volume, the Stochastic indicator focuses on another aspect of stock price changes. In other words, this indicator examines the speed of price changes in a period.
The Stochastic RSI indicator on some platforms is displayed in the range of 0-100 for easier reading, and the center line is drawn at 50. Values greater than 0.80 or 80 mean oversold conditions and values less than 0.20 or 20 mean overbought conditions.
The Stochastic RSI indicator assumes prices will move entirely away from their averages before reacting or retracing. RSI values and slopes are directly related to the momentum and intensity of price movements.
 stochastic
The primary use of this indicator is to find potential entry and exit points and the possibility of a trend reversal. The Stochastic RSI indicator is usually more critical near the upper (overbought) and lower (oversold) ranges. In addition, when this indicator is closer to the central line, it can provide helpful information about the market trend.
Average True Range (ATR) indicator
The ATR indicator, which stands for Average True Range, is the average range in Persian. ATR is one of the indicators used to measure market volatility.
This indicator is considered among oscillators. Naturally, when the intensity of fluctuations in the market increases, the range of the ATR indicator also increases. On the contrary, when the price fluctuations decrease, the ATR index also decreases.
This indicator is used to predict strong price movements and identify market fluctuations. The way to calculate it is that it calculates the difference between the high price of each period (High) and its low price (Low) and draws an average from it, usually in the 14th period.
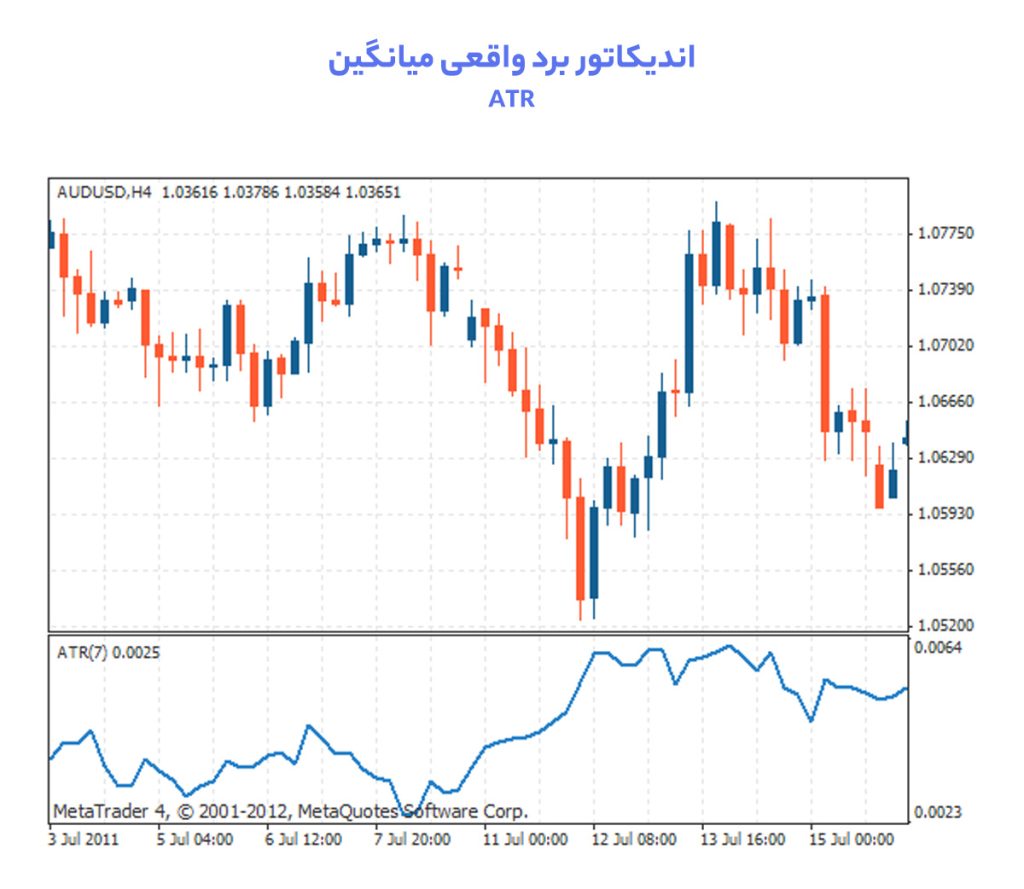
This index shows strong market fluctuations (both downward and upward) with sharp increases. It also displays the small swings that smaller candlesticks make, with a decrease in the ATR indicator.
However, note that ATR does not provide us with information about the direction of the market trend and only indicates market fluctuations. After intense swings and large candlesticks forming in the market (both red and green) leading to an increase in ATR, we should expect smaller candlesticks and candlesticks to decrease in size.
ATR indicates how much a digital currency or stock fluctuates on average daily. In other words, the volatility observed in each candle must decrease for the ATR indicator to correct and move away from its peak. Traders can use this tool to limit the loss and determine profit targets.
Introducing research tools and platforms
The rest of the article will review digital currency analysis platforms. Many of these tools and platforms are offered for free. Still, digital currency analysis tools and various other monetary platforms have also been designed and implemented, which can minimize the amount of risk in transactions by using a set of them.
The “Ideas” section on the digital currency website
Erzdigital website users can, in the “Ideas,” post cryptocurrency market analyses and t,” trials or read others’ research and tutorials. This section works like a dedicated social network, which is helpful for novice users and professional traders. Analysts can view technical analysis, fundamental analysis, and the training section on the Erzdigital website with their profile.

You can publish your technical analysis of any digital currency in this section. Also, by choosing the fundamental analysis section, you can share your opinion about the digital currency you are considering with other users.
Trading View
TradingView offers traders a specialized and accessible platform for technical analysis in various financial and global markets such as stock markets, futures, all major indices, forex, contracts for difference (CFDs), and digital currencies.
Also, TradingView is a social network for traders that allows them to interact with each other, share trading ideas, and directly analyze and trade using TradingView’s advanced charting capabilities. TradingView brings traders together by instantly sharing real-time charts and cryptocurrency analysis ideas and tools.
DexScreener _
Dexscreener is an online cryptocurrency analysis tool that allows users to filter various assets on decentralized exchanges and find the best investment opportunities. The platform tracks data for more than 20,000 cryptocurrencies across various blockchain networks.
Dexscreener has become popular because it allows you to closely monitor new altcoins that have the potential to grow in price. Dexscreener also gives users real-time price charts and transaction history (buying and selling volume and liquidity).
Conclusion
The technical analysis combines art and science—the art of interpreting, avoiding doing the ps, and psychologically underlying technical analysis for trading decisions. The secret of using technical analysis in digital currency trading is simplicity, avoiding complexity, and using it to develop trading strategies.
Combining digital currency analysis tools with some principles and using analytical platforms such as TradingView and the ideas section on the digital currency website can help you see the digital currency market differently.