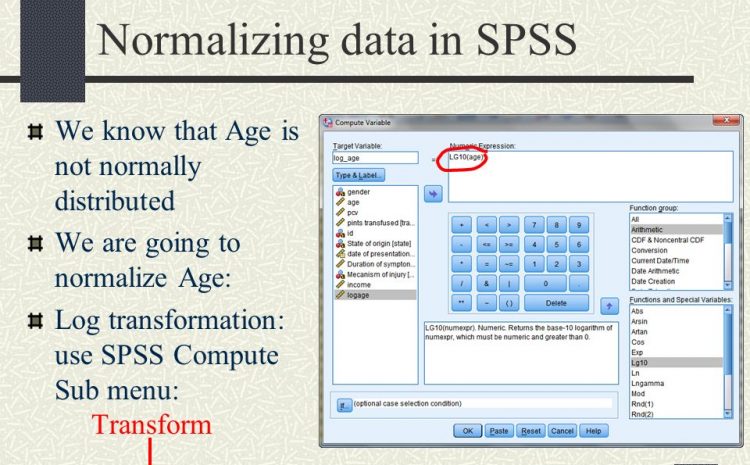
What Is Spss, What Are Its Uses And What Is The Latest Version? (Full Introduction)

Surely you, like me, have heard a lot like doing a dissertation with SPSS or doing an article, or preparing a questionnaire and statistical work and all over the internet.  Yes, in this post we…

Step-By-Step Tutorial On How To Use Spss In Descriptive Statistics (Video)

This article shows you how to use SPSS software version 12.0 to 2017 to infer data analysis and descriptive statistics.  You use this software to create histograms, sequence distributions, stem and leaf diagrams, Tukey box diagrams, calculate…

Training Of Basic Statistical Functions In Spss Software (Or Statistics Functions)

In this post , we will teach you all the main statistical functions in SPSS software , which are called statistical functions for short. Introduction This topic introduces you to the basic statistical functions. These functions are basically used…

Introducing The Main And Important Components Of Spss To Better Learn The Introductory Level

In the continuation of the series of attractive tutorials of spss software , in this post you will get acquainted with 4 important concepts.  IBM SPSS statistical software is used for data management and extensive statistical calculations. This…

Complete And Visual Training Of Descriptive Statistics In SPSS Software

In the continuation of the series of simple and attractive SPSS tutorials, we will go to the complete training of descriptive statistics in this software.  This tutorial shows you how to use SPSS version 2017 to analyze…

Step-By-Step Tutorial On How To Normalize Data In SPSS + Videos

Due to the fact that many friends have difficulty discussing data normalization, so in this article we want to teach you how to normalize data in SPSS in a visual and step-by-step manner with full explanations. Normalizing or normalizing…

Video Tutorial And Step By Step Drawing A Histogram Diagram In SPSS

Histograms are used to summarize discrete or continuous data. In other words, it provides a display of numerical data by showing the number of data points that are within a certain range of values ​​(called “bins”). …