


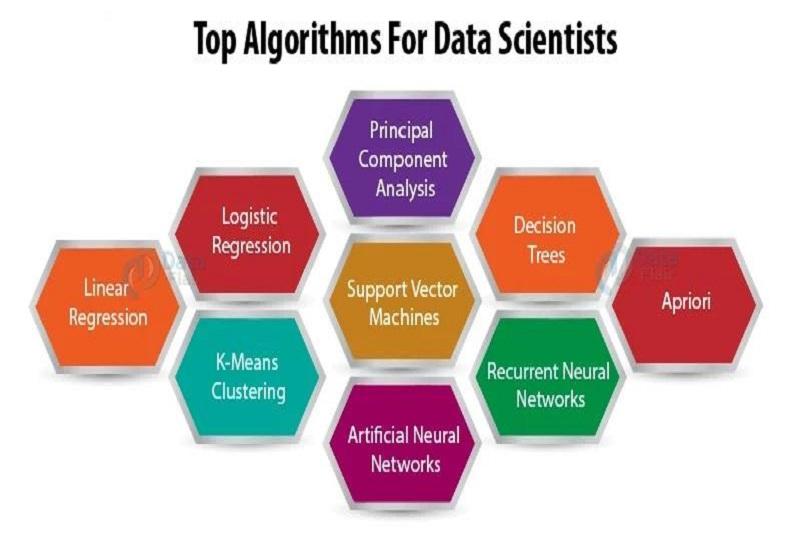
11 Most Common Algorithms Used By Data Scientists
Today, Various Algorithms Are Used By Machine Learning Experts And Data Scientists In Data Analysis Projects, Each Of Which Has Its Advantages And Disadvantages.
However, some algorithms are widely used and perform better than similar examples.
This article will briefly get to know some of these algorithms.
What is data science?
Data science is the study and analysis of data using statistical, computer, and mathematical methods to obtain new knowledge and information from data. Data science combines mathematics, statistics, computer engineering, artificial intelligence, and related subjects. This science includes collecting, storing, processing, and analyzing data using various tools.
Using these methods, one can look for patterns, relationships, and meaning in data and seek to improve decisions and make better predictions in various fields such as social sciences, life sciences, finance, etc.
Data science has significantly impacted different societies and is currently used in many industrial and non-industrial fields. For example, in medical sciences, data science can be used to analyze medical data and improve the diagnosis and treatment of diseases. Also, in industry, data science can enhance the performance of production processes, marketing, and human resource management. In general, data science allows us to use the data available in societies and industries to improve performance and increase efficiency in various fields.
Descriptive analysis
Descriptive analysis is a statistical method in which data collected from a sample is used to describe and summarize that data. This method analyzes the data numerically or non-numerically, and the mean, median, dispersion, and frequency of different values can be calculated.
Using descriptive analysis, we can extract meaningful information from the data and display the results graphically or tabularly to understand the data better. This method can be used in many fields, including social sciences, economics, statistics, medicine, psychology, etc.
In general, descriptive analysis provides insight into the past; this statistical technique is illustrative, as the name suggests. More specifically, it looks at data and analyzes past events and situations to give you a general idea about the future. Simply put, it looks at past/historical performance to reveal reasons for past success or failure. The above approach allows us to learn from past behaviors and determine how they may affect future performance.
Regression analysis
Regression analysis is a statistical method that models the relationship between a dependent variable and one or more independent variables. Using the collected data, this method uses a model to predict a response variable using one or more descriptive variables.
The regression model may represent a mathematical relationship or a graphical diagram. One of two linear or nonlinear regression types is usually used in regression models. In linear regression, the descriptive variables are related to the response variable using a straight line. The relationship between the explanatory and response variables is nonlinear in nonlinear regression.
Regression is one of the most popular data analysis methods in business, data-driven marketing, financial forecasting, etc. Regression analysis can be used in many fields, including social sciences, economics, medical sciences, engineering, etc. In data mining, this technique is used to predict values given a particular data set. For example, regression may be used to predict the price of a product, offering other variables. actor Analysis
Factor analysis is a statistical method to reduce the number of dependent (response) variables in a data set. In this method, we convert several dependent variables into critical factors to reduce the number of variables. Factors are linearly related to dependent variables, and each element usually represents a vital data feature. In this method, by using the covariance matrix or correlation matrix of the data, we obtain the key factors and can use them to analyze complex data.
Using factor analysis, we can look for hidden patterns in the data and analyze the behavior and relationship between the variables, obtaining ways that may not be easily observed and explained but can provide explanations for interpreting the data. Factor analysis is commonly used in various fields such as psychology, social sciences, medical sciences, etc.
More precisely, factor analysis is a data analysis technique derived from regression to find the underlying structure in a set of variables. The above approach emphasizes finding new independent factors (variables) that describe the patterns and relationships between the primary dependent variables.
Factor analysis is an intelligent solution for researching the relationships of variables and is mainly used in connection with complex issues such as psychological scales and socio-economic status. Factor analysis is an essential step in achieving clustering and classification methods efficiently.
Scatter analysis
Dispersion analysis means examining the dispersion of data and the amount of difference between data. In this method, we can use various statistical measures such as variance, standard deviation, and coverage to check the dispersion of the data. Variance indicates the amount of distribution of the data, so the higher the variance value, the more scattered the data.
The standard deviation also shows the data’s dispersion, so the higher the standard deviation, the more scattered the data. Coverage also indicates how much data is in a particular range.
Scatter analysis is instrumental in better understanding the data and finding hidden patterns. Using scatter analysis, we can understand more about a data set and look for secret ways. This method can be used in many fields, including social sciences, medical sciences, economics, etc.
Scatter analysis is not very common, but it is used in data mining, and some professionals use it. The above technique describes the spread of a set of data.
Measuring dispersion helps data scientists study and understand the diversity of subjects. In general, distribution has two critical issues. The first shows the changes between the elements, and the second is the changes around the average value. The dispersion is high if the difference between the value and the mean is significant. Otherwise, it is low.
Diagnostic analysis
Diagnostic analysis is a statistical method used to investigate the causes of problems and disorders in data. In this method, we use the collected data to find the roots of the issues in the data and ways to fix them.
In other words, diagnostic analysis helps us identify problems and deficiencies in data and find ways to fix them. This method uses statistical criteria such as mean, variance, standard deviation, and correlation coefficient.
Diagnostic analysis is commonly used in various fields such as medical sciences, psychology, economics, etc. Using this method; we can look for solutions to fix the problems and improve the data, thus achieving a more accurate analysis and interpretation.
The diagnostic analysis is one of the most powerful classification techniques in data mining. The diagnostic study uses a variable measurement approach on different groups of elements to delineate or, more precisely, demarcate the points that distinguish the groups from each other.
Time series analysis
Time Series Analysis means examining changes and time patterns in data. In this method, data is collected and analyzed sequentially over time.
Time series analysis includes many statistical methods, such as ARIMA, spectral, and graphical modeling. Using this method, we can identify different temporal patterns in the data and seek to predict future developments.
Time series analysis is commonly used in various fields such as financial management, economics, social sciences, etc. Overall, time series analysis can help us identify patterns in time data and seek solutions to improve them. For example, in economic sciences, time series analysis can be used to predict the trend of growth or stagnation in the economy.
In almost all scientific fields, measurements are made over time. These surveys lead to the production of organized data sets called time series. The most significant example in this field is the daily value of the stock market index. In its simplest definition, time series data analysis is the process of modeling and explaining time-dependent series of data points. The goal is to extract meaningful information from the data.
Artificial Neural Networks
It is the most popular and newest method of data analysis. Artificial neural networks, often called neural networks, are a metaphor for the brain’s ability to process information. Inspired by biological samples, these networks enable computers to function similarly to the brains of humans or other organisms. These computational models are borrowed from biological samples. They consist of an interconnected group of artificial cells and process information using a computational approach.
Neural networks are widely used in data mining. They can accept and process noisy data well, and their output is accurate. Neural networks are used in many commercial prediction and classification applications.
Evolutionary programming
Today, data management agencies use evolutionary algorithms to overcome the challenges associated with big data. Evolutionary programming combines different types of data analysis using evolutionary algorithms and is very popular in data mining. Genetic algorithms, genetic programming, and evolutionary algorithms are the most used examples in this field.
They can search spaces and discover efficient solutions, are almost insensitive to noise (a problem that machine learning experts face), and handle interactions between features in an excellent decision tree, a tree-shaped diagram representing a classification or regression model.
A decision tree divides a data set into smaller and smaller subsets containing samples with similar values, while at the same time, a related decision tree is continuously developed. The tree uses branches to show how and why one choice might lead to the next. The operation of decision trees is easy to understand and makes the classification process simple and fast. It is the most famous and modern data mining and machine learning classification algorithm.
Random forest
Since the picture above is cloud forests, explaining more about the trees is not harmful!! Decision trees start with a fundamental question. Should I surf? Will the waves last long? The story begins from this point, followed by other questions that aim to find an answer to the main question.
Does the wind blow on the beach? These questions form decision-making nodes in the tree and are a solution for dividing data. Each question helps the expert reach a final decision, denoted by a leaf node. Decision trees seek to find the best partition for a subset of data and are usually trained through a classification algorithm and a regression tree. Observations that match the criteria follow the “yes” branch, and comments that do not check the requirements follow the alternative path.
Fuzzy Logic
Fuzzy logic is a mathematical method used to model complex systems and make decisions under conditions of uncertainty and ambiguity. In this method, instead of using precise and binary values (0 and 1), fuzzy and ambiguous values (between 0 and 1) are used.
Fuzzy logic allows us to look for better ways to make decisions in situations where the data has ambiguity and uncertainty, using concepts such as “high,” “low,” “medium,” etc.
This method makes decisions based on fuzzy probabilities and fuzzy values. For example, fuzzy logic can decide the robot’s direction and speed in robotics. Fuzzy logic is commonly used in various fields, such as robotics, industrial control, artificial intelligence, decision-making systems, etc.
In general, fuzzy logic allows us to make better decisions and improve the performance of systems in the face of complex conditions and uncertainty.
Fuzzy logic is used to deal with uncertainty in data mining problems. Fuzzy logic modeling is one of the probability-based data analysis methods and techniques, it is relatively new, but it has a great capacity to extract valuable information from different data sets.